![]()
Days
of Sunshine
by
John L. Daly
![]()
In other articles and papers on this website, it has been demonstrated that while the greenhouse industry, led by the IPCC, claims there has been a global warming of around +0.5 deg.C this century, this is based entirely on data from a highly flawed surface network of thousands of measuring stations, mostly located in cities. While there may have been some warming this century, it is unlikely to be as much as the half degree claimed. (See "What's Wrong With The Surface Record?" for a detailed critique of the surface record). However, for the purposes of this discussion, it will be assumed there has been some global warming over the last 120 years, by an amount up to +0.5 deg.C, even though +0.25 deg.C would be a more realistic figure.
Given that assumption, the question then arises as to what caused it. Was it just natural variation? Was mankind to blame due to greenhouse gases? Or, was it the primary engine of our warmth, - the Sun?
![]() Our Variable Star
Our Variable Star
The Sun appears to us as a steady brilliant light in the sky. Its temperature is nearly 6,000 deg.C and its radiation of light and heat across the vast distances of space weakens in proportion to the inverse square of that distance. By the time solar energy reaches the Earth, the radiation amounts to 1,368 watts per square metre (w/m2).
This figure is known by solar physicists as the "Solar Constant"
Q. -
When is a constant not a constant?
A. - When it's
the Solar Constant !
The solar `constant' is actually a variable. Contradictory as this may sound, it is only fairly recently that the radiation from the Sun has been proved to vary according to a highly predictable cycle. The variations so far observed from satellites are not much - a mere 0.2% change in mean radiation (or about 2 w/m2).
Extreme short-term variations have been recorded of up to 0.4%. The Sun, in effect, behaves more like a flickering candle, and has been accurately measured doing this by various satellites, including the ill-fated "Solar Max" satellite whose 9-year sample of solar radiation from 1980 to 1989 proved conclusively that the Sun was indeed a variable star.
("Solar Max" became a victim of the very thing it was meant to observe. It was placed in a low orbit just outside the Earth's atmosphere. This was its undoing, as the build-up of solar radiation in 1989, due to the approaching Solar Maximum, caused the outer atmosphere to heat up and expand, and capture the satellite. Solar Max was then slowed by friction and burned up in the atmosphere.)
Further evidence of the Sun's variability came from the Shanghai observatory of the Chinese Academy of Sciences in April 1990, when they reported that the Sun's radius had shrunk 410 kilometres from 1715 to 1987, based on solar eclipse studies. A shrinking sun since 1715 would result in a hotter solar temperature, and increased solar radiation, consistent with a warming of the Earth as claimed by the IPCC.
Fig. 1 shows Solar Max's measurement of total solar irradiance, proving the variability of the Sun. -
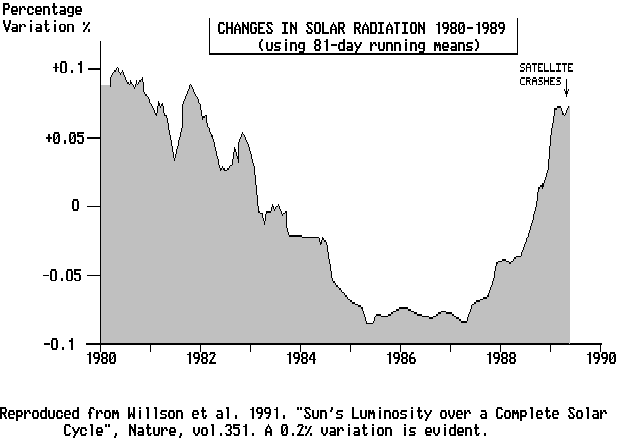
Fig. 1 Solar Variability as Measured by `Solar Max'.
![]() The
11-Year Solar Cycle
The
11-Year Solar Cycle
We can measure the variability of the Sun by either direct measurement of it's radiation, as done by "Solar Max" and "Nimbus-7", or by it's emission of microwave energy. Such observations reveal that the Sun goes through a regular cycle of activity, with its radiation peaking every 11 years, an event known as the Solar Maximum. During periods in between these peaks of activity, the sun cools slightly, a phase in the cycle known as the Solar Minimum. These cycles are quite consistent, and are predictable to within a year. The last maximum peaked in June 1989 and extend well into 1991. The next maximum is predicted by Australia's Ionospheric Prediction Service to peak in May 2000.
During the Solar Maximum, the sun breaks out in sunspots, a direct indication of more intense solar radiation and activity. Although the sunspots are darker than the rest of the sun, this does not result in less radiation as one might think, but results in the rest of the sun being hotter. Counting the number and size of sunspots is therefore an indirect measure of how active the sun is, rather like the severity of blemishes on the skin being an indirect measure of general health.
Although we did not have the benefit of satellites before the 1970's to measure solar radiation, we do have accurate data on sunspot counts going back to around 1600 AD. The cycle is shown in fig. 2 below, where the 11-year peaks of the solar maxima are clearly visible. The intensity of a Solar Maximum is not the same from one cycle to the next, nor are the cycles themselves of exactly the same duration. Eleven years is only an average, but some cycles are are little as 10 years, while some others may extend to 12 years.
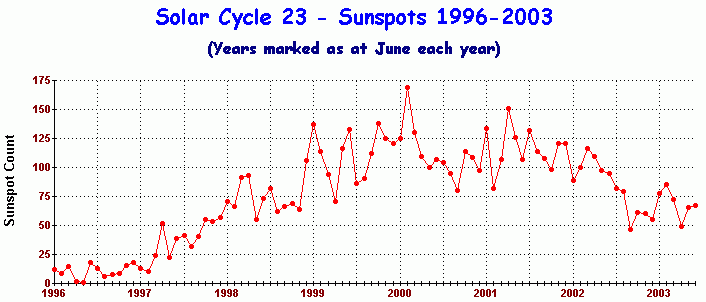
Fig 2. Sunspots since 1700 AD
The most remarkable event in the last 500 years was the `Maunder Minimum', a 50-year period from 1650 to 1700 when there were hardly any sunspots at all, indicating a prolonged cooler period on the Sun. Another period from 1800 to 1830 shows very reduced activity, and a further moderate period in the late 19th and early 20th century. Contrast these with the heightened level of activity and warmth in the latter half of the 20th century, the most intense since solar observations began around 1600 AD.
It is possible to estimate global temperature back to 1600 AD based on indirect proxy measures such as tree ring widths, pollens, oxygen isotopes in ice cores etc. and when we combine estimates of global temperature and the average of sunspot counts since 1600 AD, we find a close relationship between the increasing solar activity from its low point in the Little Ice Age around 1600 AD and estimated global temperature.
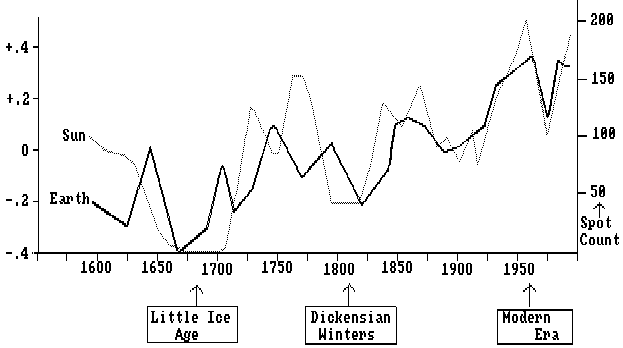
Fig.3 - Global Temperature and Solar Activity 1600-1990 AD Compared
Recent claims that the Earth is now warmer than at any time in the last 600 years are actually quite true, but this is merely a misleading statistical sleight of hand hiding the fact that global temperature was at a historic low point 600 years ago. If we go back in time a little further, say, to 800 years ago, we then find we are starting at the high point of the millenium (the `Medieval Optimum'), resulting in our period being cooler than it was during the time of the Vikings. It's all a question of the year you choose to start from. If you start 600 years ago during the Sporer Minimum, then there has been a long term warming since then . But starting 800 years ago, we find a cooling. Selective use of the start date of any data series is the oldest statistical trick in the book.
Reference to the climatic graph for Europe of the last 1,000 years (fig. 4 below) shows that the Maunder Minimum of solar activity during the 17th century occurred at exactly the same time as the Little Ice Age. The low level of solar activity in the period 1800-1830 coincided with another cool climatic period dubbed the "Dickensian Winters" (Charles Dickens was a young boy at the time, and his novels depicting snowy Christmases in London, which normally does not get snow in December, reflects his memories of childhood). 1816 has been called "The Year Without a Summer", due to the severe cold which affected America and Europe that year. In 1814, a frost fair was held on the River Thames in London, indicating that temperatures had very briefly descended to even the Little Ice Age level when Thames frost fairs were common.
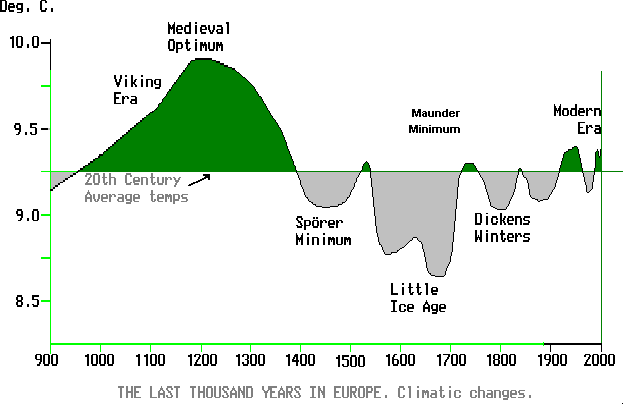
Fig.4 - Climatic Change in Europe 900 AD to Present
The late 19th century was another cooler period, exacerbated by the Krakatoa eruption of 1883. Since that time, the Sun has grown steadily more active, with the biggest Solar Maxima ever recorded peaking in 1957 (based only on sunspot counts), or 1980 (when based on modern satellite and microwave measurement). According to Willson & Hudson (Nature, 2-May-91), the Sun exhibited a "remarkable irradiance excess during 1980, at about the time of the sunspot maximum of solar cycle 21". It is hardly any coincidence that global climate warmed up at exactly the same time, as measured by satellites (the most accurate measure of global temperature).
Since the cooler sun was clearly responsible for the Little Ice Age, and the Dickensian Winters, then the hotter Sun of the latter half of the 20th century would naturally create a warmer climate. This is consistent with the view that some warming has occurred.
The Little Ice Age (and Maunder Minimum which caused it) do present one puzzle though, namely, that the Little Ice Age was more severe than would be justified by a -0.2% reduction in solar radiation alone. We know there was a cooling of about 1 degree from todays average, and yet we also know that a 0.2% reduction of solar radiation during the Maunder Minimum would not have been enough in itself to cause such a severe climate downturn.
The 0.2% solar cooling estimate is only based on recent satellite observations, covering only 17 years. Over a longer time span, variability in the sun may very likely exceed this level. Indeed, observations by Lockwood & Skiff of 36 nearby stars similar in size and makeup to our own sun, revealed that nearly half of them varied by more than 0.5% in brightness over a time interval of less than 4 years. If our sun behaves in a similar way over longer periods, then the severity of the Little Ice Age and the Dickensian winters period becomes explainable exclusively in terms of solar variations.
So, how much is the Sun responsible for the 20th century warming?
If we assume a solar radiation increase of only +0.2% in recent years only, (or a 2 w/m2 increase in solar radiation), the Stefan-Boltzmann Law tells us that 20th century warming should be about +0.15 deg.C. However, the evidence of the Little Ice Age suggests secondary effects which combine to cause a temperature change up to 3 times as great. Using this criteria, the 20th century warming would therefore be -
+0.15 x 3 = +0.45 deg. C.
This is only slightly less than the +0.5 deg warming claimed by the IPCC. Since, unlike Greenhouse, the Sun's impact on climate is certain, there is little or no room left here for the Greenhouse Effect. It is for this reason that greenhouse promoters downplay the role of the Sun, or more absurdly, to even to deny that the sun has any role at all. They even persist in the fiction of referring to the variable level of solar radiation as "the solar constant". For them to admit to solar variability would deny Greenhouse any role at all in what little warming there has been in the 20th century.
Fig. 5 shows variations in direct solar radiation during the 20th century, with a very obvious extreme peak in 1980. This is based on a composite of measures developed by Foukal & Lean. The intense solar peak of 1980 is associated with a sharp warming of climate between 1976 and 1980, as is the 1957 event. The solar minimum years, such as 1976, are associated with cooler climate.
Since the oceans are able to absorb and buffer the immediate short-run impact of most solar maxima, short-term correlations between temperature and solar maxima show up most readily when the maximum is a very large one, as in 1957, 1980, and 1990. However, weaker maxima may be masked by other climatic processes, such as the El Nino Southern Oscillation. In the longer term, the heat retention capacity of the oceans would result in long-term climatic warming in reaction to a succession of several major solar maxima, as shown by the last four intense solar maxima.
Fig. 5 Solar Radiation during the 20th Century
![]() New
Discoveries from Denmark
New
Discoveries from Denmark
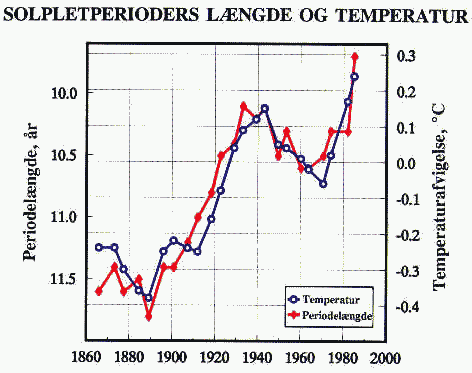
In November 1991, Danish scientists Eijil Friis-Christensen and Knud Lassen, startled the climatological world with a paper in "Science" describing a 0.95 correlation between solar cycle length and global temperature (IPCC version). "Science" writer, Richard Kerr described it as "one dazzling correlation".
 |
Fig
5. Solar Cycle Length and Global Temperature (surface)
(The blue line is temperature, the red line is solar cycle length) As can be seen, global temperature has tended to increase in lockstep with shortening of the solar cycle length (ie. solar maxima becoming more frequent) |
(Graph from Denmark's Meteorologiske Institut).
Friis-Christensen and Lassen's theory to explain this correlation was that if the time duration between solar maxima peaks was shorter, then the earth was collecting more net energy overall than if the time between maxima was longer. The cycle averages 11 years, but it does shorten to about 10 years at times, and can open out to 12 years. From the maximum of 1980 to that of 1990, the cycle was only 10 years, resulting in the 1980s collecting greater warmth from the Sun than would be usual for other cycles.
Where the maxima are very large ones, as in the last 4 cycles, then a shortening in the time duration between maxima will increase the long-term energy input into the earth-atmosphere system.
By 1996, Friis-Christensen and Lassen had extended the solar cycle length/temperature correlation back to 1580 AD (removing any possibility of coincidence). Recent findings by their team (Svendmark & Christensen) has demonstrated that reduced neutron particle bombardment during solar maxima has the effect of reducing global cloud cover by up to 4%, more than sufficient to warm the earth by the observed amount due to less reflection of solar radiation by clouds, as evident from the stong correlation shown in fig.6 below.
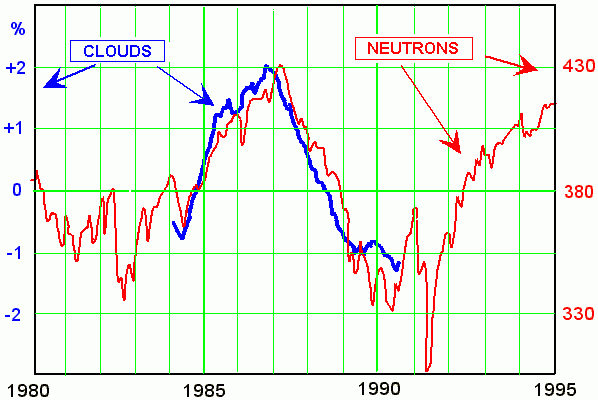
Fig.6 Correlation between solar neutron bombardment and global cloudiness (Svensmark & Christensen)
When sunspots are at a reduced level of activity, such as during the Maunder Minimum from 1650 to 1700, the same phenomenon works in reverse, ie. neutron bombardment would be maintained at a higher level than normal giving greater cloud cover and therefore greater global cooling. This effect would easily cool the Earth 1 deg.C, or even more, during the Little Ice Age. Some solar physicists predict that the Sun will soon enter another cooler phase, similar to the Maunder Minimum or Dickensian periods (See Theodor Landscheidt's paper on this website). It is inconceivable that the Sun can maintain the high levels of activity experienced during the last four solar cycles indefinitely into the future. This would suggest future global cooling, making discussion about Greenhouse somewhat academic.
This explanation for the claimed warming this century is more credible, given the Sun is our heat source, whereas natural greenhouse gases can only recycle existing heat.
![]() To
Conclude ...
To
Conclude ...
The Earth has certainly warmed in the last 100 years, although not as much as suggested by the IPCC. However, the Sun has also been hotter during the same period, so that some, if not all, the warming is attributable to the more intense solar activity this century and to the shortening of the solar cycles themselves.
If indeed there has been warming, it is clear the Sun did it, not mankind or greenhouse gases.
![]()
Return to "Still Waiting For Greenhouse"