Cheap Solar Cells
(6 Oct 03)
According to a recent CNN news report
("Discovery
May Spur Cheap Solar Power" - CNN 2nd Oct 03),
a European consortium, STMicroelectronics, is completing development of a new and better solar cell. It is only 10% efficient under sunlight
(in comparison with 20% efficiency achieveable with the current silicon
cells), but it is up to 20 times cheaper to produce than silicon cells of equivalent size. The current cost
of around $4 per watt of energy produced, compares with around 20 cents per
watt for the new cells.
With a cost only a twentieth of the current level, solar cells can now become a serious competitor to normal mains electricity. For example, suburban houses could have their roofs covered with such solar cell units, making households
partially or wholly self-sufficient in electrical energy without taking out a second mortgage to pay for it.
A fanciful prospect? Just think about how quickly cities and suburbs sprouted TV antennas and satellite dishes once the technology became available - or how quickly teenagers became married to their mobile phones so soon after their invention.
This is the future, a future where fossil fuel use may decline, not because bureaucrats and UN environmentalists demand it as a means to impoverish whole societies, but because the market finds new, better, and cheaper ways to obtain power. It is the market, not governments, that have transformed our standard of living in the 20th century. The same markets are doing and will continue to do this work of technological advancement long after the IPCC are just a
bitter aftertaste in history books.
For any young scientist wanting to be part of the future and not languish in some moribund bureaucracy bemoaning lack of funding, the market is where the exciting action is, not government institutions. In the final analysis, governments do not create - they merely re-distribute, and usually make a mess of that.
Medieval Warmth in Alaska
(3 Oct 03)
A new paper in Science (v.30,
26 Sept 03, p.1890) by Feng Sheng Hu et al, reveals that western
Alaska enjoyed the full warmth of the Medieval Warm Period (850 AD to 1200 AD), based on cores from tundra lake
sediments. There was also a previous warm period from 0 AD to 300 AD,
the periods of warmth apparently following a cyclic pattern, consistent with
changes in the Sun.
Ordinarily, climate events 1,000 years ago
would not excite public interest, were it not for the IPCC's obsession with a
spurious claim, based on the flimsiest of evidence, that no time in the
past was as warm as it is today.
This is the infamous `Hockey Stick' theory,
the latest incarnation of which was recently published in Geophysical Research
Letters.
The key claim of the `Hockey Stick' theory
was that the major known climatic events of the past millennium - the Medieval
Warm Period and Little Ice Age - were merely local events in Europe and that
the bulk of the northern hemisphere - and even the world as a whole - enjoyed
an even and stable climate until the human warming of the 20th century. That's
the theory - and none of it is true.
Now we have recent evidence that it spread
far beyond Europe, all the way into the northern Pacific via western Alaska,
thus rendering the `Hockey Stick' as a junk theory which is now only propped
up by political correctness and public vilification of its critics.
Numerous papers and studies are now being
published which demonstrate what a nonsense the IPCC's `Hockey Stick' really
is, and its almost fanatical adoption by the greenhouse industry reflects
badly on their scientific competence.
See - `The Hockey Stick: A New Low in Climate Science'
This Week - Flagstaff,
Arizona, USA
Flagstaff is only 25 miles north
of Sedona, Arizona, the home of presidential hopeful, Senator John McCain.
He is co-sponsoring a bill in the US Congress to introduce CO2 emission controls on US industry
and society.
He claims that the `warming' at his
home of Sedona is what got him interested in `global warming' [ref.]. Since
Flagstaff is the nearest weather
station to Sedona, its record is presented this week to examine the alleged warming that is
so motivating Senator McCain.
Senator John McCain moved
to Sedona in 1980 and so his climatic knowledge of that area must of
necessity only date from 1980. Here is the record from Flagstaff
dating from 1894. Being the second largest urban centre in
Arizona, there is also some urban heat island component contained in
this record. However, there appears from the record to be no sign
of any long-term warming. There is decadal variability such as the
cooling early in the 20th century, a warming during the 1920s (everywhere seemed to warm then, long before greenhouse
gases were even an issue), a high point around the 1930s, cooling
during the 50s and 60s, followed by another warming during the
80s. Of particular note is the fact that temperatures during the
last two decades are hardly different to those which existed during the
1930s and 1940s. In other words, Sedona as a rural area is
unlikely to have exhibited trends much different to those of
Flagstaff. Since there was no pseudo-scientific hype at that time
about `global warming', why all the hysteria now? Even if we look
at Flagstaff's record only from 1980 when McCain arrived in Arizona,
there is still no warming to speak of.
So, why is Senator John
McCain jumping on this particular bandwagon when his pretext for doing
so - warming at Sedona - is clearly nonsense?
Russia
in `No Hurry' (30 Sept 03)
According to `The
Russia Journal', President Putin of Russia poured cold water on any
early ratification of the Kyoto Protocol by Russia. He said that the decision
would be made only after the entire system of `complicated problems' connected
with the protocol was studied in detail and kept `in line with Russia's
national interests'.
While this is not exactly a `nyet' to Kyoto, it is not an
endorsement either. Without Russia, there is no protocol. There is
also one added problem - time.
The Kyoto Protocol expires by 2012 at the very latest,
and 6 years have passed since the protocol was originally put on the
international table. By the time Russia gets around to ratification (if they ever do), the protocol will be well past its
use-by date.
Station of the Week - Northern
Norway (3
Oct 03)
"Climate change is the biggest and most serious environmental threat
we face," said Norwegian Environment Minister Boerge Brende, in
response to the icy reception given to the Kyoto Protocol by Russia's
President Putin.
Clearly, Mr Brende
doesn't know his own country, at least not its climate. While he
drew parallels between Norway's far north and Russia's far north, he
should have checked the temperature records for northern Norway to see
if his alarmist claims held any substance.
Here is the temperature
history of four stations in Norway's far north - Vardř at 70.4N 31.1E,
Bodř at 67.3N 14.4E, Tromo/Skatto at 69.5N 19E and `Ship M' located
in the Norwegian Sea at 66N 2E until 1990. (The
figures for 2003 are of course provisional only).

The warmest period of the
20th century stands out clearly from the graph of the three land stations
- the 1930s, not recent times.
Another anomaly is also
evident - the record from Vardř around 1920. There appears to be a
distinct step-up increase in mean temperature from around 0.5°C before
1920 to around 1.5°C after 1920. That suggests a change in the
climate data, not a change in the climate itself. It could be due to
equipment replacement or changes in procedures (similar
changes took place in Australia around 1911 which affected station data).
Whatever the cause, it is clearly not natural.
Since 1920 there has been
no climate change in northern Norway of any significance, and Mr Brende
was being just another alarmist environment minister. Most such
government ministers in Europe are not really ministers for the
Environment at all, but ministers for the Environmentalists. As
such, they are hardly credible authorities on climate matters, as is
clearly the case here.
Postscript:
8 Oct 03
Willis
Eschenbach < willis@taunovobay.com
> did a closer examination of Vardř and also found the same
discontinuity around 1920, amounting to 0.73°C. When that artificial discontinuity is
discounted, the temperature rise is only +0.12°C per century, a tiny
result for a region that according to the models should have undergone
rampant warming in the last century.
"Sucking Away Our Rain" (19 Sept 03)
Australia's public broadcaster, the ABC,
presented a new
scare story titled `Drought Vortex' on their Catalyst science
programme, using information from Dr David Jones of the Bureau of Meteorology,
Dr James Risbey of Monash University, Melbourne, and Kevin Hennessy of the
CSIRO Atmospheric Division.
The story was basically that Australia may
be subject to much less rainfall in future due to a cooling Antarctic `sucking
away Australia's rain' into the Antarctic vortex. This was described as
`a revolutionary new theory' (yes, yes, another one)
to explain how this was all to happen.
Another new set of predictions (correction - `projections') is nothing to be
particularly concerned about, especially as these seem to change with each
turn of the weather, more frequently even than theories about food
nutrition. What was more significant about the story is the re-writing
of past history that the `new revolutionary theory' requires.
Kevin Hennessy of the CSIRO said on camera -
"What we've seen in the past 30 years or so is that
many of these cold fronts have moved further south so fewer cold fronts are
bringing rain to places like Perth, Melbourne and Hobart"
That's not what Hennessy was saying in
1999. According to a CSIRO statement on `Australian Rainfall
Trends', a study by
Hennessy et al (Aust. Met. Mag. 48, 1-13,1999)
claimed that `annual total rainfall has risen by about
15% in New South Wales, South Australia, Victoria, and the Northern Territory,
with little change in other states. The study also reported a
significant 10% rise in the Australian-average number of raindays.
Also, in a CSIRO
press release dated 26 April 1999 titled "Don't
Forget your Umbrella: Australia has Become Wetter this Century", Hennessy himself was quoted as saying "One
of the most interesting findings from our study was an increase in
Australian-average heavy rainfall". He went on - "The heaviest daily rainfall event has become 8% more
intense in summer with little change in the other seasons".
His 1999 press statement and the findings of his 1999 paper are inconsistent with his latest ABC statement about
what has been happening in the `past 30 years or so'.
The ABC story also
revealed something which is news to most people but which has been
known about in climate circles for a long time, but kept largely
quiet. The Antarctic continent has been cooling in complete
defiance of climate models which show it should be warming. But
the ABC story delivered a quick and ready excuse - "While the rest of the world gets warmer due to
greenhouse gases, Antarctica is cooling due to ozone loss.".
Data from Antarctica does not
support such a loose assertion. Ozone loss (the
famous ozone hole) only occurs for about one month per year
during the spring.
Ozone is normal for the other 11 months of
the year, and so the greenhouse gases should have warmed the continent
during the other 11 months. The chart shows the springtime and
annual temperature history at Vostok, a Russian base near the geographical
centre of the Antarctic continent. Neither the spring nor the annual
temperature shows any dramatic long-term changes, either toward cooling or
warming, and kills any argument that springtime ozone loss is causing the
Antarctic to cool, or that greenhouse gases are causing a warming. It
appears the Antarctic is doing its own thing despite what the best models and
industry climatologists say should be happening
"I love a sunburnt country,
A land of sweeping plains,
Of ragged mountain ranges,
Of droughts and flooding rains."
"Her pitiless blue sky,
When sick at heart, around us,
We see the cattle die -
But then the grey clouds gather,
And we can bless again
The drumming of an army,
The steady, soaking rain."
The worst drought ever in Australia was not
the recent one (caused as usual by El Nińo),
but the so-called `Federation Drought' at the end of the 19th century which
lasted several years. Who or what `sucked away Australia's rain' that
time? Periodic droughts are normal in Australia as are periods of heavy
rainfall. What is new is that each time we move from one natural weather
state to the other, the greenhouse industry jumps up to blame each one in
terms of `global warming'.
The best statement of what
Australia's weather is like comes, not from the CSIRO or the ABC, but
from a poet 100 years ago - Dorothea MacKellar, who, in her poem `My
Country', penned the verses shown here (abridged).
`Baked Alaska'?
(16 Sept. 02) (Espańol)
The New York Times is at it
again. They spread a false story a few years ago (`Water at the North Pole') which they were later
obliged to retract. Then they published a story about Alaska climate
which was publicly repudiated by the Alaska Climate Research
Center.
Now they have just
published a story titled `Baked Alaska on the Menu?' (New
York Times (NYT) 13 Sept. 2003) in which they have mounted similar falsehoods.
Their story opens with a heart wrenching
story about Kaktovik, an Alaskan village on the Arctic Ocean, where a robin
built a nest last year (a pest invasion?), where
willows have decided to grow on the nearby river banks (noxious
weeds?),
and where there are now three types of salmon in nearby waters where none
previously existed. "We're not getting as
many icebergs as we used to" says one 92-year old. Robins,
willows, salmon, fewer icebergs, - life is getting really tough at
Kaktovik.
Of course, that's all just newspaper hype
and hyperbole, none of it verifiable. And NYT is not noted for its
accuracy in reporting such stories as evidenced by recent scandals over
plagiarism there.
But let's get down to hard facts.
Half-way through the article, they state quite categorically - "Alaska has warmed by eight degrees, on average, in the
winter, over the last three decades, according to meteorological
records. The U.S. Arctic Research Commission says that today's Arctic
temperatures are the highest in the last 400 years, and perhaps much
longer." Firstly,
the U.S. Arctic Research Commission
is an obscure little Washington bureaucracy with only three fulltime staff - an `Executive Director'
based in Arlington, VA, an `Administrative Officer' also at Arlington, and a `Senior Staff Officer' in Anchorage,
AK. Apparently, the NYT regards them as more authoritative than
scientific bodies like the Alaska
Climate Research Center that actually reside in Alaska.
Going back to NYT's statement, eight
degrees is presumably Fahrenheit (they omitted to say
which units applied), or about 4°C. The main weather station on the
Alaska Arctic coast is Barrow, and its record of winter temperature is shown below -
As we can see, climate today is not warmer
than years ago. The co-warmest years (at
-21.13°C) were 1942 and 2001, while the record clearly shows a period
of `warmth' during the 1920s and 1930s (in common with
the rest of the Arctic), followed by a period of cooling in the
post-war period until 1976 (also Arctic-wide),
then a climatic recovery in recent years to levels similar to those which
existed back in the 1920s and 1930s.
But notice how they qualified their claim "...over the last three decades". The
average of the `last three decades' produces a result shown by the thick blue
line, achievable only by being selective about the time frame and ignoring
previous years when climate was warmer. It's a form of statistical
selectivity which has become commonplace in articles and publications by the
greenhouse industry. As for the reference to today's temperatures being
the highest in 400 years, the above record shows that the 1920s and 1930s must
also have been `the highest in 400 years'. But even with the reference
to 400 years, we see exactly the same statistical approach at work - 400 years
ago, the world, and Alaska, was in the grip of the Little Ice Age, and
therefore of course any temperature today will be warmer than
that frigid period. It's all in the time frames you choose. The
scientific way of presenting data is to present all of it, not just the
bits and time scales that suits a desired viewpoint. The NYT to their
discredit chose to do the latter.
The final sentence of the NYT story reads - "Unless we act soon, we may find waves lapping the
beaches of Ohio". Given that the lowest point of Ohio is
around 140 metres above mean sea level, that has to be the most stupid remark of
all in a very stupid article. Even if every last lump of ice on the
planet, glaciers, Greenland, even Antarctica, all melted into the sea, the sea
would rise a maximum of 65 metres, less than half the height of Ohio.
Even the normally alarmist IPCC only predicts a maximum sea level rise of less
than 1 metre in the next 100 years.
Finally, what of the title - `Baking
Alaska'? Is NYT seriously suggesting minus 25°C is `baking'?
Even today's mid-summer temperatures at Barrow are barely above freezing.
Hot
Cities in Colonial America
(13 Sept 03)
A correspondent has drawn
my attention to a book by William B. Meyer titled "Americans and Their
Weather" (Oxford University Press 2000, ISBN 0 19 513182
7). That bane of weather station records, the `Urban Heat Island
Effect' was recognized as early as the American colonial era in the
horse and buggy days. Page 29 says in part -
".... It was a Charleston physician, Dr. Lionel Chalmers, who in 1776 offered the fullest early explanation of the
phenomenon now known as the urban heat island: the tendency for temperatures to be higher in cities than in the surrounding
countryside. [52] The presumed direct connection between heat and ill-health made it especially troubling, given the
already high summer temperatures. Jefferson as president urged his territorial governors in laying out or extending towns
to reserve alternating squares of a grid pattern for trees and open space. Europeans, living under cloudy skies, could
"build their town in a solid block with impunity," he judged, "but here a constant sun produces too great an accumulation
of heat to permit that." The extremes of the American summer demanded a greater spread of "turf and trees." But the inconvenience of dispersing settlement and the seeming waste of building lots told too heavily against the plan. It was not
employed in the extension of New Orleans; in the one southern case where it was tried, the new capitol city of Jackson,
Mississippi, it was quickly eroded, and the reserved lots turned to more productive uses.
[53]"
The reference [52] to Dr Chalmers comes from L. Chalmers,
"An Account of the Weather and Diseases of South Carolina" (London: Edward and Charles Dilly,1776), I: 30-31. Meyers main academic reference [53] was John W. Reps, "The Making of Urban America: A History of City Planning in the United States" (Princeton, N.J.:
Princeton University Press, 1965), 314-17, 321-22.
For the Urban Heat Island to be not only recognized, but considered a health
threat as far back as 1776, its magnitude must have far exceeded the few
tenths of a degree accorded to it by the greenhouse industry today, most
notably by GISS and CRU. Those early years in America were well before
industrialisation and motorised transport and yet the urban effect was
recognised even then to the extent that corrective action was called for,
though not carried out. The Urban Heat Island Effect today must be much
greater in the much larger, more heavily built-up, and more mechanised, cities of
today. A concrete jungle beneath a baking sun is not a normal air
temperature environment, yet data from such artificial sources are treated by
the industry as if they were.
Weather station records from towns and
cities today are worthless for climatic comparison purposes or for
determination of historical global mean temperatures precisely because of this
urban effect contaminating the data. Only genuinely rural stations (`rural' as in green fields environments, not merely smaller
towns) can best represent climatic trends. Alternatively, the
satellite temperatures provide the best global coverage, albeit only from
1979.
Super-Model (15
Sept 03)
Britain's Open University in collaboration
with numerous other partners, including the Met Office, has launched a new programme for their climate
model, this time attempting to recruit a few million people around the world
who are prepared to donate their PC idle time to processing a climate model
run.
Each PC will have a slightly different set
of parameters so that the modellers can see the full range of model outputs
without having to tie down valuable time and resources with their own
computers.
I tried the model on my own PC, and promptly
deleted it after a few hours.
The organisers claim the model will not
interfere with normal PC functions, basically acting like a screen saver, but
when I next went on the internet, my traffic was inexplicably frozen after a
few minutes, forcing me to reboot. After rebooting and closing the
model, my internet connection was fine again. I then deleted the model
as a precaution.
As to what the model is like, it just sits
there like a parasite on your computer, doing its own thing with no
input allowed from the user. The user does not even have the ability to
experiment with the model in a second window or as a secondary task.
Instead, the model simply runs itself, and will do so for weeks on end before
the run is complete. The host gets nothing out of the exercise, nothing
at all.
However, some altruistic PC users may feel
they are doing this `for science'. This view would be both false and naive.
The experiment is not about climate, but about one climate model among
hundreds, not the same
thing at all. The resolution of the model is no better than for other
models, the sole purpose of this exercise being to get a lot more model runs
than would be possible otherwise. The final output will be no more authoritative than other models, because in the end it is still just
a coarse simulation of climate, not the real thing.
It's a pity that whenever science asks for public involvement in their work, they only want compliant servants, not
genuine participants. I was initially happy to participate, but decided
to back out after the internet freeze-up and the inability to experiment with the
model as a subsidiary task. In the spirit of give and take, the organisers were taking plenty,
but giving nothing in return.
Tropical Cold
(8 Sept 03)
Darwin, the capital city of the Northern
Territory and deep in the tropics, normally has daytime temperatures around 32
to 33°C all year round, with overnight temperatures typically in the low to
mid 20s celsius.
But not this August or September.
There were some of the coldest temperatures in decades during August and
finally on 5th September, Darwin recorded the lowest September temperature
since records began, 15.1°C., a real cold snap for a tropical location
like Darwin. The previous lowest
temperature was 16.7°C on the 9th of September 1963.
The local media was informed of the new record and it will be available here.
The records are also published in the NT Monthly Weather Review.
However, had Darwin recorded a hot temperature record, it would have been
proclaimed loudly from the rooftops of all the major media, announcing the
coming of the greenhouse Armageddon.
But for a cold record? Only the local
media takes interest or needs to know.
Frost Hollow (7 Sept 03)
According to The Times of London (Weather Eye: September 2, 2003 by Paul Simons) one of
the coldest places in Britain is paradoxically in the warmer southeast region
of England - namely the Meteorological Office’s weather station at Redhill, Surrey. So far this year it has
recorded the coldest temperature in the UK on 33 days, including sub-zero temperatures in April and
as late as May. The question is, why does Redhill get this cold?
The weather station is located at a small airfield nestling under gently sloping hills and bordered by
a motorway embankment. On clear, calm nights, the sandy soil rapidly loses heat and cold air
drains down the surrounding slopes, collecting in a shallow dip around the
airfield. It remains there trapped during the night in a so-called `frost
hollow'. Apart from frost, it is also prone to mist and fog from early evening until the following morning.
The Met Office is considering moving the weather station to avoid these cold
anomalies even though there are dozens of other similar frost hollows across southeast England.
And is that a valid reason to move
the station? To move it to avoid `cold anomalies' would only be
appropriate if similar action were taken against stations with known warm
anomalies - such as Heathrow Airport, or the London area generally.
But if only stations with `cold anomalies'
are targeted like Redhill and other frost hollows, while the warm anomalies
like Heathrow are left unchanged, then the only result can be an entirely
artificial warming in the
temperature averages for southeast England. When that `warming'
manifests itself, who will be the first to proclaim `global warming'?
- You guessed it , the Met Office.
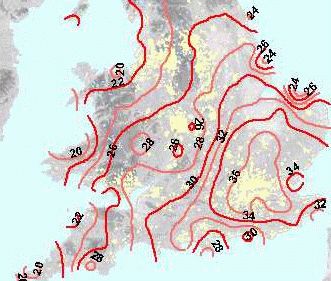
Central England Temperature (6 Sept 03)
`Central England
Temperature' is a unique temperature history going back to 1659 which
combines weather station records from within a triangle bounded by
Preston in the northwest, Bristol in the southwest and London in the
southeast, as shown by the map.
When the series began 344 years ago,
England was a very different place to what it is now. The start of the
English Industrial Revolution was still over 100 years away and most of
central England at that time was rural.
Today, all that has changed.
There has been over 200 years of industrialisation and
urbanisation. Within that little triangle, lie the cities of
London, Bristol, Birmingham, Manchester, Oxford and many other towns and
cities, containing tens of millions of people, all interlinked by
crowded motorways and other highways and railways.
The temperature history is
presented below. From the graph, we can clearly see the Little Ice
Age of the late 1600s, (which happened to coincide
with the Maunder Minimum on the sun), the years when it was
common for the Thames to freeze over in winter. Following that was
a period of warmth during the 1730s, nearly as warm as today, even
though England was still green and rural at that time.
The Industrial Revolution - and the
urbanisation that went with it - dates from about 1780 and we see a
creeping warmth taking place from that point. At around 1880,
modern temperature recording began at many places in the world,
providing the data for CRU and GISS to compile their `global mean
temperature' reconstructions.
It was in 1988 that the `global
warming' scare began, and central England temperatures began another
warming phase at around the same time. However, the recent warmth
shown on the graph is only slightly warmer than the rural warmth of the
1730s before the Industrial and urban revolution even began. Given
the urban concentration today, it is surprising that Central England
Temperature is not now even higher.
Central England Temperature (CET) undergoes curious changes in appearance
once presented by institutions for whom `global warming' is a dogma
central to their existence. For example, Britain's `Environment
Agency' presents the graph shown below, which they indicate
originated with the Hadley Centre, comparing it directly with global
mean temperature. On their website, they
state -
"The central England temperature record is the longest continuous record of measured surface air temperature in the world. In conjunction with the global temperature record, it provides dramatic evidence of global warming."
As we can see from the above graph,
the evidence is hardly `dramatic' - nor is it evidence of `global
warming' for the simple reason that urbanisation and motorways have
turned what was once a `green and pleasant land' into a concrete heat
trap. The CET has been corrected for urbanisation though - by a
princely 0.1 to 0.2 degrees celsius! That adjustment would be
scarcely enough to correct for a small town of a few thousand people,
let alone mega-cities like London, Birmingham, and Manchester. It
is a thoroughly inadequate correction statistically.
But there is one other curious aspect
to the graph below. Notice that the graph starts, not in 1659 when
the CET really began, but in 1770 - right at the start of the English
Industrial Revolution. They have left out a whole 111 years - for
what reason?
If we look at the above chart back to
1659, the 1770 cut-off line is marked in dark green. From it we
can see two events that the Environment Agency (and
presumably the Hadley Centre) have chosen not to present to the
public - the Little Ice Age of the late 1600s, and the warm period around
the 1730s.
Take
the 1730s first. If England could get that warm during a
rural period in its history, what is so remarkable about being
warm today during a period of intense urbanisation?
That leaves us with the Little
Ice Age. That's the event that the authors of the `Hockey Stick', say never
happened. But here it is turning up large as life in the
CET record.
That of course is only if the whole
record is presented as shown in the first graph. The Environment
Agency wants the public to make the direct comparison between CET and
global temperature by displaying both in the second graph. They have omitted the existence of the
Little Ice Age from the earlier part of the record, because that would
invite the obvious question -
If CET
is directly comparable to global temperature,
then does not the manifest existence of the Little Ice Age in the
CET record
also imply the existence of the Little Ice Age as a global
event?
That would contradict the `Hockey
Stick', so vital to the greenhouse industry, and so the solution
for the Environment Agency was to simply leave out both the Little Ice
Age and the warmth of the 1730s altogether and present only that part of
the CET they wanted the public to see.
The Party's Over
(25 Aug 03)
A report in The Australian newspaper ( "Scientists Face Axe in CSIRO Cutbacks" - Australian 25 Aug 03) says that the Atmospheric Division of Australia's CSIRO
(the Commonwealth Science and Industry Research Organisation - Australia's main government science research body) may lose up to 20 scientists from its
staff.
These cutbacks are the result of a $2 million reduction in the Division's budget.
It has spent so much time, resources and effort in researching
Greenhouse, `climate change' and related issues that they have failed to
give adequate attention to research that might have been of genuine economic value to
Australia - such as predicting the El Nińo/La Nińa oscillation. Greenhouse and `global warming'
may be more glamorous in international forums and journals, but the wasteful
expenditure on these scare scenarios at the expense of more important priorities, has meant these scientists have contributed, and are contributing, absolutely nothing to Australia's economic wellbeing.
The federal government is quite justified in pulling the plug under such circumstances.
This division of the CSIRO has not only feasted itself on public fears about
climate change, over the years it has helped to fan those fears.
Besides, Australia's Bureau of Meteorology and several universities already do research into climate and climate change, and having the Atmospheric Division of the CSIRO doing it too is wasteful duplication.
The CSIRO's basic purpose is scientific research of direct benefit to the economy and industry - not
duplicating research of questionable relevance to Australia being done
elsewhere. It is that lack of direct economic benefit from the
Division's work over the past 15 years which has brought about their loss of relevance to the basic purposes of the
CSIRO.
Of course, the federal government could simply close the division altogether.
It would hardly be missed.
Arctic Ice Thicker This Year (23 Aug 03)
The heat wave in Europe, or a heat wave anywhere for that matter,
often has one unexpected by-product. Any heat wave is usually caused by
a blocking anticyclone which traps heat in one general region, preventing the
normal movement of heat to other parts of the globe. The heat build-up
during the heat wave forces the heat to be radiated away to space and lost,
instead of being passed around to add warmth to other places which normally
receive it.
Such
seems to have happened in the Arctic. According to a feature in `Newport
This Week', a pair of Arctic adventurers, Susan Adie and Brad Stahl, went
to the North Pole this summer on the Russian ice-breaker Yamal (the same one on which an IPCC `scientist' started the `Water at the North Pole!' fiasco in the New
York Times, later to be retracted) and reported the ice to be much
thicker than usual this year. According to their account -
"This was one of those years
where we wondered `Where is the global warming?' We made two attempts
this year to get to the North Pole but only made it once. From Svalbard
to Franz Joseph Land, there was a massive series of ice flows, 800 miles
north/south and up to 14 miles east/west. The ice was up to five meters
thick." They further reported that the captain of the Yamal
had rarely seen the ice this thick in his 35 years of polar voyages.
One feature of Arctic climatology is that both
temperatures and ice thickness and extent undergo very large year-to-year
variations. Consequently thin ice one year is quite likely to be
followed by thick ice and lower temperatures the next. It's all quite
normal for that part of the world. This year it is the cold that
rules. Not only is the ice thicker, but neither the Northwest Passage
nor the Northeast Passage have opened this year. They have opened
periodically ever since the first transit of the Northeast Passage in 1878 and
the Northwest Passage in 1906. Nowadays, the mere opening of either of
these passages is excuse for a `global warming' declaration by environmental
`scientists', but these polar passages have been opening on and off ever since
voyages to the frozen north began over 100 years ago. But not this
year. The heat wave in Europe may have denied heat to the Arctic.
Bleeding Canada Dry
(23 Aug 03)
Dr. Kenneth Green, who is Chief Scientist and
Director for the Risk and Environment Centre of The Fraser Institute in Canada has issued
a
dire warning to Canadians about the economic consequences for Canada of
fulfilling the terms of the Kyoto Protocol. Canada ratified the protocol
in spite of protests from industry and provincial governments.
According to Green, the additional $1 billion
the Canadian government plans to spend on Kyoto this year will enable them meet 8%
of Canada's Kyoto target. Since it cost Environment Canada about $150 million to administer a budget of $841
million last year (or about an 18% administration fee), then Chretien's pledged $1 billion for greenhouse gas reduction might
realistically cost nearer $1.18 billion.
But since it also costs money to raise money the estimated 17 cents to extract
every $1 in tax revenues from the public means that to raise and spend $1 billion
would actually cost around $1.35 billion. Taking this one step further,
if it costs $1.35 billion to meet a mere 8% of the Kyoto target, then achieving 100% is going to cost at least
$16.88 billion.
Green says it doesn't end there. Studies suggest that for every dollar a government spends on
regulatory initiatives in the US or Canada, the private sector spends 20 times as much in order to comply.
If we factor in that additional cost, the full societal price tag for Kyoto compliance in Canada
comes to about $354 billion!
And that $354 billion, if it's to have any effect, will have to be spent before 2008, since the 2008-2012 time period is
the one by which Canadian greenhouse gas emissions are supposed to have been reduced to 6% below those of 1990.
Spread out over the 5 years, that's about $71 billion per year taken out of
Canada's GDP or about a 6% annual reduction in GDP. That's averages to about $4,700 per taxpayer per year for
the next 5 years!
That estimate is probably on the low side, says Green, because the first 8%
reduction will be easier to extract than the next 8% (on
the principle that the easiest tasks are always the ones done first),
the costs escalating for each succeeding set of reductions. Hence while the first 8% might cost
the basic $1 billion, the next 8% is likely to cost more, and so on with each succeeding step toward the
final target.
Dr Green's final estimates do not of course
take into account the likely effect of hostile non-co-operation by many
sectors of industry and provincial governments. Overcoming that
hostility may cost billions more in enforcement costs due to the additional
policing and inspection regimes which would become necessary.
Dr. Kenneth Green can be contacted at the Fraser Institute keng@fraserinstitute.ca
Hockey Stick Mk.II (21 Aug 03)
Greenhouse scientists Michael Mann and Philip Jones (GRL v.30, no.15, 1820, 2003) have launched `Hockey Stick
Mk.II'. It will be remembered that Hockey Stick Mk.I was
published several years ago and became instantly adopted as policy by the IPCC.
In a nutshell, the `Hockey Stick' theory presented a 1,000-year `reconstruction' of northern hemisphere temperature and in so doing denied the existence of the Medieval
Warm Period and the Little Ice Age as hemispheric or global events during the previous millennium. This
denial then allowed them to incorrectly assert that the 20th century was warmer than any previous century and that `1998 was the warmest year of the millennium'. This was in spite of a large body of peer reviewed literature confirming the existence of these two climatic events during the last 1,000 years.
Hockey Stick Mk.II now extends the time period back 1,800 years, but using much the same technique, this time taking a mere 23 selected proxy sites
(tree rings mostly) to represent the whole world, processing them statistically, and then grafting the result onto the CRU version of global temperature during the last century
(that CRU series is itself disputed due to urban contamination of weather station temperature
records).
Is this version of climate history credible? Just because it has appeared in peer-reviewed literature is no sufficient reason to
accept it. Papers which affirm the existence of the MWP and LIA are peer reviewed too - and much more numerous.
So what might be wrong with Hockey Stick Mk.II? Basically, everything that was wrong with Mk.I
(see `The Hockey Stick' - A New Low in Climate
Science), namely it denies a mountain of
contrary evidence.
Three central problems arise with Hockey Stick Mk.II.
Firstly, grafting a data stream from one type of marker (tree rings and ice cores) onto a completely unrelated data stream
(weather station records, most of them urban) is simply bad practice statistically. It's the proverbial apples and oranges comparison, making the result quite meaningless.
Secondly, there was no attempt to deal with the huge volume of peer reviewed literature attesting to the existence of the two major climatic events which Mann & Jones deny - the Medieval Warm Period and the Little Ice Age.
(A small sample of this literature is reviewed here). One recent paper by Soon & Baliunas
(Clim. Res. 23, 89-110, 2003) also used proxy data and
concluded the two events really did happen. But Mann & Jones' response was this comment, delivered as
if it were a statement of fact instead of what it really was - merely a statement of their opinion.
"A flawed recent study [Soon and Baliunas, 2003] compels us to stress two points..." etc.
etc.
A statement opened and phrased in that way is a clumsy attempt to pre-judge the issue and can only be viewed as a political statement, not a scientific one.
Such political tactics do not belong in scientific literature and should have been queried by the reviewers.
Opinion is not science, especially in a controversial matter like this.
Finally, tree rings are an unsatisfactory proxy for determining regional or global temperature.
They only cover the growing season, not the winters. They only cover the daytimes, not the night. They only cover a fraction of land areas, with no ocean coverage at all
(amounting at best to perhaps 15% of the planet's
surface). The rings themselves are conditioned by a variety of environmental factors of which temperature is only one.
With such limitations, it is absurd to even imagine that something as grandiose as `global mean temperature' could ever be determined from them, let alone `reconstruct'
past temperatures as Mann & Jones have done to a claimed accuracy of tenths of a degree!
As to the 23 proxy sites, that is
much too small a sample to conclude anything, particularly as they were selected against other proxies which may have told a different story. If one selectively chose 23 weather stations out of the thousands available, one could even prove we were headed for an ice age, or a global heat wave - selectivity
and intensive statistical processing allows any outcome to be produced.
The final nail in the coffin of Hockey Stick Mk.II
is contained in their own graphs. In their reconstruction of recent
decades (shown left), the authors overlapped the weather station record
(red line) with the reconstructed proxy record (blue). And the two make a very poor
match. The CRU weather station plot shows much wider temperature
variations than the proxy plot. If the weather stations are
assumed to be more accurate than the proxies, then the 1,800-year
reconstruction presented by Mann & Jones is largely an artifact of
statistics and data selectivity. As one commentator
remarked -
"It looks like the authors are just
averaging together a bunch of noise."
Correction to Story (20 Aug 03)
A story titled `A Cracked Record' published here on
13 Aug, contained an item of incorrect information. It was stated that on 10th August
(the day on which Britain recorded its highest maximum temperature on record of 38.1°C at Gravesend,
London), that the temperature at Hastings 50 miles away was 23°C. This figure was based on information published in the Times of London. It is now established that the Hastings figure was actually 33°C, not 23°C., a probable typo
error on their part. Consequently, comments about the temperature at Hastings are also not applicable.
To clarify the events of that day,
see the British
Met Office's website where a page featuring 10th August is presented.
It included this map of maximum temperatures on 10th August 2003.
It is clear that the highest temperatures were concentrated in the southeast of England, particularly in and near the London urban
conurbation. Urban areas are coloured in yellow. South-eastern England is one of the most urbanised areas on the planet and that consequently the `Urban Heat Island Effect' is
regional in impact.
The highest isotherm, 36°C, is concentrated precisely around the London area
- hardly an accident of nature. Clearly, the
very presence of London itself can turn a warm summer into a heat wave.
Within that isotherm there are localised `hot spots', particularly Gravesend and London Heathrow Airport which between them touched temperatures around 38°C,
or 2°C above the average isotherms shown on the Met Office map.
From this it can safely be inferred that Britain can thank the existence of increased urban development in the London area, and associated increased traffic density, as being primarily responsible for the temperature record, not world climate or `global warming'.
The Met Office website also has interesting information about 1976, the last time when Britain had an extended heat wave
(1976 was a very cool year globally). They say -
"During the long hot summer of 1976, temperatures exceeded 32°C (90 °F), somewhere in the UK, on 15 consecutive days starting on 23 June. This year, 32°C was exceeded on three consecutive days between 4 and 6 August and then on five consecutive days between 8 and 12 August, somewhere in the UK (temperatures failed to reach 32 °C at any of the real-time stations on 7 August)."
So we must ask, which of the two heat waves was the more climatically significant? The 1976 one with its blistering 15-day unbroken heat wave? Or the 2003 one comprising two brief heat waves of 3 days and 5 days each, where the maximum temperature on one day scored an all-time record assisted by increased urbanisation and traffic density? World climate was cool in 1976, so it does not require any global effect to set off a summer heat wave in
south-eastern England. The increased urbanisation and traffic factor seems able to do that all on its own.
Beware Badwater ! (31 Jul 03)
Today is 31st
July 2003, with August about to begin. This is the hottest period in the
USA, and the weather station at Badwater in Death Valley, California, is primed
yet again to record the hottest temperature ever recorded on the planet.
If it breaks the
all-time world record held by Al Aziziya, Libya (58°C, or 136°F) in 1922, expect the champagne corks to fly in the
greenhouse industry, celebrating yet another sign of `global
warming'.
But be warned, if it happens this
August, it will be a complete fake. I visited the site myself last year
and saw what was going on, a weather station sited in such a manner as to make a
world record well nigh inevitable one day, maybe this year.
It's equivalent to a sprinter
breaking a world record with a hurricane at his back.
See all about Badwater here
Hot
in the City (8 Aug 03)
Europe is currently in the middle of a heat
wave.
That's not unusual. There was a really
bad one in 1976 where temperatures even in rural areas of Wales reached the
low to mid 30s celsius. But we are now told that long-time records are being
broken, such as in London, which media `scientists' are quick to blame on
`global warming' without looking at any other probable or contributory causes.
So, let's look at Atlanta, Georgia, in the
USA, `Hotlanta' as some people call it. It can get very hot there in
summer, which added to high humidity, can be a potent mix for people living
there. However, if Atlantans wanted to cool off, they need only drive 25
miles southwest to rural Newnan, which has a temperature history as long as
Atlanta's. And they make for a revealing comparison.
As we can see from the graph,
Atlanta used to be about 2.5°C cooler in August than Newnan in the
horse-and-buggy days of the late 19th century. Now Atlanta is about
1.5°C warmer than Newnan, making a total average warming in Atlanta during
August of 4°C. That's around 8°F warmer. No wonder they call it Hotlanta.
What happens in Atlanta happens in every similar city in the world - it
creates its own heat bubble from all that concrete under the blazing summer
sun and all the heat and ozone pollution from the dense traffic. In Britain,
the towns and cities are so close together, linked by busy highways, that the
heat bubbles of each city are connected by heat corridors created by the
highways linking them. In the end, even the adjacent rural areas are
affected.
Sure, it's man made, but it's a
strictly local phenomenon, not a planetary one. It's not `global
warming' but `urban warming'. The solution is also local - better city
management (trees, parks, irrigation etc.) as was
done in Adelaide.
Heat Wave (6 Aug 03)
It's becoming an annual ritual, the greenhouse industry exploiting each and every summer heat wave as a portent to future catastrophe, hoping we will all forget the earlier cold and snowy winter. So too with the latest heat wave in Europe. `Unprecedented' goes up the cry, `record-breaking' goes another. `Stop Climate Change' says
GreenPeace, oblivious to the absurdity of such a phrase.
But are heat waves in Europe so unusual? 1976 was a particularly dry, hot year in Britain, resulting in many vegetation fires. During many earlier heat waves, railway tracks were known to buckle under the heat stress. But is this summer's heat any worse than many previous heat waves?
In some ways it may be.
Firstly, Europe is very densely packed with people and urban growth. Some parts of Europe, including Britain, have the some of the highest population densities in the world. This worsens the `urban heat island effect', which is
particularly pronounced during winter nights - and cloudless summer days as the sun bakes all that exposed concrete and brickwork.
Many of the world's cities, such as Tokyo and Atlanta, are now experiencing temperatures in summer days that border on the lethal - not because of `global warming', but because of
local warming from urban heat. Of course, it is still man-made heat, but the solution is not grandiose international protocols, but simply better management of the local urban environment. More trees, more parks, less concrete, that's the way to cool down a city. Adelaide in Australia did it, that city having experienced a long-term cooling precisely because of the way the urban environment has been managed over several decades.
Secondly, the increasing traffic in cities has become so congested that vehicles are burning up gallons upon gallons of petrol and oil, sometimes going nowhere due to
traffic jams. This results in a particularly nasty kind of pollution - low level ozone. Not the friendly kind in the stratosphere to protect us from the sun's harmful UV rays, but ozone in the same air we breathe. It's toxic, but it's also something else. Ozone is a greenhouse gas, a particularly powerful one as it absorbs the earth's heat radiation at the very wavelengths which normally pass directly to space. In a city environment, this means that heat radiation from all the concrete is unable to escape directly to space, but is redirected downwards back onto the city, heating it up even further. It's the greenhouse effect all right, but not the global carbon dioxide greenhouse effect we have all heard about. Instead, it's a local urban greenhouse effect sitting over every urban area like a thick blanket on a hot summer's night. Little wonder the city gets hot. But, go well out into the countryside and you will find it hot in summer, certainly. But not `record-breaking' hot, not `climate change' hot, just your usual summer-like-when-we-were-kids hot.
Better transportation systems in cities would go a long way to moderate this kind of pollution, as would improved vehicle design. It is no accident of nature that Sunday always seems cooler in the city than a working weekday. But then, Sunday is always a light traffic day.
Britain's Guardian newspaper declared with absurd logic, "Climate Must
Change" (6 Aug 03), but in an earlier page displays reminders of last winter in
a splendid set of snow photos.
How memories fade. Here in Australia, it is the southern winter and our snowfields are enjoying
a bumper ski
season.
A record-breaking heat wave in a city proves nothing. It could be cooled, like Adelaide was, by better management of the city environment itself.
`Global' action to address `climate change' will not and cannot work because the root cause of the problem is local, not global.
Gone Tropopause (28 Jul 03)
Those veterans of the global
warming industry, Ben Santer and Tom Wigley, have just released a
model-statistical study claiming that the world really is warming (Science v.301, 25 Jul 03, p.479), based on claims that
the height of the tropopause has increased (the
tropopause is an atmospheric boundary layer about 12 km altitude).
This time, their paper starts with the words - "Observations
indicate that the height of the tropopause - the boundary between the
stratosphere and troposphere - has increased by several hundred meters since
1979." The atmosphere always expands with the 11-year solar
cycle (a phenomenon which was the downfall of the `Solar
Max' satellite about 12 years ago when it was captured from a very low orbit
by an expanding atmosphere which ironically was triggered by the very thing
Solar Max was sent up to observe - the sun). The atmosphere
expands during a solar maximum due to the additional solar heating and
contracts during the cooler phase of a Solar Minimum, so what has this to do
with observations of the tropopause since 1979. To answer that question,
refer to this chart of the solar cycle since 1979 -
We have had
3 solar maxima since 1979 versus only 2 solar minima. Therefore the
balance of the solar effect is clearly in favour of solar maxima, i.e.
atmospheric expansion, over this time scale. Wait until the end
of 2008 and we will have another solar minimum behind us, enough to
re-balance the solar effect on the atmosphere.
The `observed' increase in the
height of the tropopause is therefore an artifact of the years used
because 3 does not equal 2. Had this study been done in 1999, or
delayed to 2008, the result would be very different.
So much for the
`observations'. The rest of their paper was just another modelling
study. According to Santer and Wigley - "Comparable
increases (in the height of the tropopause) are evident in climate model experiments". So,
they used a flawed statistical interpretation of post-1979 observations to
underpin their model experiments. That being the case, what does that
say about the model? Here is what the model presented -
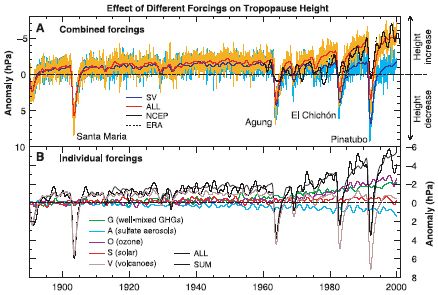
We can
tell this is modelling because there were no observations back to 1890
when their chart begins. As modelling goes, its assumptions are highly
questionable. Their presentation of the solar forcing shows none
of the increase in solar radiance which has been well proved by other
solar studies. Even the 11-year solar cycle is not visible in this
model. Their presentation of the `sulfate aerosols' is largely
conjecture as no-one has yet proved observationally that the sulfates
even have this effect (the lack of warming in
the southern hemisphere suggests if anything the reverse effect to
that shown).
The presentation of `well mixed GHGs' (greenhouse gases) is all pervasive, not
because that forcing is in any way real, but because the model is
programmed that way.
WMO Joins the IPCC Mantra (6 Jul 03)
A short press release by the WMO
(World Meteorological Organisation - a UN body), dated 2nd July, attracted worldwide publicity.
In the release, the WMO put the spotlight on `extreme weather events', the latest fad being promoted by the greenhouse industry to explain away the lack of general warming
predicted by the climate modellers.
Extreme weather events are anything from a heat wave here, a hurricane there, a flood somewhere else, mixed in with a tornado or two. Thanks to the world getting smaller through excellent communications - and the ubiquity of camcorders
and mobile phones in so many hands, any extreme event today can get the full media treatment. A tornado in Oklahoma reaches Australian TV screens in full technicolour barely minutes after the event.
It creates the perception that such events are on the increase, when it reality it is merely the
reporting of such events that has increased.
Most of the WMO press release was just a repeat of already discredited claims by the IPCC in their 2001 report - the claimed 0.6°C 20th
century warming, the 1990's being the warmest decade etc. etc., 1998 the warmest year etc. etc., and so it went on - a catalogue of
tired old claims which have peppered the press releases of nearly every environmental
group since the IPCC first made them in 2001. Even the discredited Hockey Stick was thrown in for good measure, even though that concept is seen by so many scientists to be
merely junk science at its worst.
The WMO pointed to warm records being set in places from India to Geneva (the home town of the WMO), but omitted to tell us that those records were set in cities, a clear result of localised urban warming from
growing expanses of concrete baking in the sun, not climatic warming as such.
They claimed that 562 tornadoes during May in the US was a record for any month without also pointing out that
population increases in tornado-prone areas, along with greater penetration of mobile phones and camcorders,
means that hardly any tornado can now occur without being noticed and reported by someone. Years ago, many if not most tornadoes simply went unreported due to lower population density and poor communications.
They finally claimed that globally, May 2003 was the second warmest May temperatures on record. Since that record is contaminated by thousands of city-borne temperatures measured amid baking urban concrete, cities that are
continuously growing and therefore getting hotter, that claim is also scientifically unsupportable.
The WMO even had the nerve to include cold events in their shopping list of horrors, pointing to below average cold temperatures in North America.
Apparently, the new creed views cold events, and even cold records, as all part of the `global warming' phenomenon.
Such an absurd claim creates a closed logical system when even colder than normal weather can be attributed to
warming. This denies the fundamental scientific principle of falsifiability - the need for any claim to be
seen as false if a particular set of circumstances are met. If all weather events, both hot and cold, are attributed to warming, how could warming itself ever be tested for its validity as a theory?
It would be self-proving whatever the weather or climate may be. That's not science - that's
ideology.
But just like weathermen everywhere, the WMO sums up with - "extreme weather events might increase".
Might? A bet each way in the best tradition of weather forecasting.
WMO Update: May 2003 - the 2nd Warmest Ever? (13 June 03)
The WMO are now revealed to be as ideological and
unscientific as the IPCC. They claim that May 2003 was the `second
warmest May ever'. Based on what evidence? Third world
thermometers? City thermometers near baking concrete? Airport
thermometers blown by heat from 747 exhausts, plus even more
concrete?
No, the
satellites are the only available way to measure global temperature variations
- the only way. According to the satellites, May 2003 was the 4th warmest in only 25 years, not exactly spectacular news considering May 2003 was still
influenced by El Nińo. Here is the chart for all the months of May
since 1979. Three years were warmer (1998, 2002,
1983), while May 2003 was only two thousandths of a degree warmer than
two other years (1980 and 1991).
On this pathetic performance, we can disregard the WMO
as having any scientific credibility when it comes to climate.
WMO Update:
More Extreme Events, or Just More Reporting?
(17 Jul 03)
The WMO in Geneva was put this question by a
correspondent in the light of the WMO claim in their press statement that
extreme events were on the increase -
"According to the above press release, the current climate continues to break records. In the statement it says:
"New record extreme events occur every year somewhere in the globe, but in recent years the number of such extremes have been increasing." Could this simply be the result of better communications and higher reporting of extreme weather than ever before?""New record extreme events occur every year somewhere in the globe, but in recent years the number of such extremes have been increasing." Could this simply be the result of better communications and higher reporting of extreme weather than ever before?""New record extreme events occur every year somewhere in the globe, but in recent years the number of such extremes have been increasing." Could this simply be the result of better communications and higher reporting of extreme weather than ever before?"
The reply by Ken Davidson (Director,
World Climate Programme, WMO) effectively contradicted the WMO original
`scientific' statement. His response to the question -
"You are correct that the scientific evidence (statistical and empirical) are not present to conclusively state that the number of events have
increased. However, the number of extreme events that are being reported and are
truly extreme events has increased both through the meteorological services and through the aid agencies as well as through the disaster reporting agencies and corporations.
So, this could be because of improved monitoring and reporting."
So there you have it.
Communications and monitoring have improved markedly since decades ago,
and it is this factor which has influenced the `increase' in extreme
events. The original WMO statement was clearly misleading and
unscientific as it did not qualify its claims with a caution about the
communications/monitoring factor.
`Farmers Against Ridiculous Taxes' - F.A.R.T.
(3 Jul 03)
By their
Government's own hand, New Zealand is the world's laughing stock this
week. Their government signed onto the Kyoto Protocol and promptly
identified flatulence in sheep and cattle as a significant source of methane, a
greenhouse gas.
In order to raise
about $8 million to pay for `research' into ways to reduce the flatulence, the
government has decided to levy a `Flatulence Tax' on all sheep and cattle.
(No, this is not 1st April, this is 3rd July.). Naturally the
farmers are not only outraged at being singled out to pay for the
government's own ill-advised Kyoto commitments but that the method - a
flatulence tax - is about the most ridiculous idea ever conceived by government.
In retaliation,
the farmers have formed their own lobby group against the tax - `Farmers Against
Ridiculous Taxes', or F.A.R.T. for short.
But think how
this idea could be extended. Human flatulence for starters. We could
not only tax people for their anti-social flatulent acts in public, but also ban
those foods known to cause severe flatulence - prunes and beans would be prime
targets for such a ban. Instead of `Beanz Meanz Heinz', we could replace the popular
advertising slogan with `Beanz Meanz Warmz'.
Meanwhile, I'll
take another check on my calendar - maybe it is 1st April after all - at least
in New Zealand.
Ski
Australia ! (29 Jun 03)
`Ski resorts' and `Australia' are not usually
spoken of in the same sentence. It may come as some surprise to many North
Americans and Europeans that the `sunburnt country' - Australia - actually has a
flourishing winter ski industry.
Instead of familiar names like Aspen or
Chamonix, Australian ski resorts sport weird names like `Perisher Blue', `Mt Baw
Baw', and `Thredbo'. The southern winter ski season is now upon us.
During the late 1980s as the greenhouse scare
gathered momentum, driven by a new breed of ideologically-driven scientists, the
Australian ski resorts were warned that they would soon be dinosaurs, deprived
of their precious snow by the ravages of global warming. Instead, 15 years
later, the ski resorts are still flourishing with no sign of the predicted loss
of snow cover on the ski slopes.
So, for a novel view of Australia, check out
the current snow report for `Perisher Blue', a resort that has not perished on
the altar of global warming politics.
Snow Report for `Perisher Blue'
(and other Aussie ski
resorts)
School for Green Cadres
(22
Jun 2002)
Many political movements in the past have
carefully trained their activists, what the Communists used to call `cadres', a
highly motivated and semi-professional corps of agitators. While the aims
of such organisations have varied, the notion of training people to engage in
mass persuasion has been a hallmark of political, lobbyist, activity for many
decades. There is nothing particularly wrong in doing this, but it is
prudent for the listener to at least know where the speaker is coming from when
they make their impassioned speeches.
According to a
report in Environmental News Network, this kind of training is now to be
applied to `climate change'. A weekend conference to be held in Boston in
July will provide training for would-be activists to develop a short `elevator
speech' and a half-hour presentation. In exchange for this training, each
participant is to commit to give at least 5 speeches on campuses, `faith'
groups, business groups or other community venues during 2003-2004, and to
arrange a meeting with a political leader or opinion leader on climate policy.
So next time you hear an impassioned speech
from a Green activist on global warming, just remember that he/she has been
specifically trained in the art of persuading large groups of people. It
is unlikely that such people will want to field challenging questions as their
presentations will be highly scripted - by someone else.
Permian Extinction (22 Jun 03)
A recent book release by a Bristol
University professor was reported in the media making claims that a global warming of
+6°C at the end of the Permian period 250 million years ago wiped out up to 95% of species existing at that
time. Volcanic eruptions were held to blame.
First, we know what happens to global climate in the wake of volcanic eruptions, especially big ones. The Earth cools. It cooled nearly a
degree in the wake of the Mount Pinatubo Eruption, and also cooled after the Krakatoa eruption over 100 years ago. This is the natural
equivalent of the `nuclear winter' effect, a well known result of major eruptions.
Coolings like that are more dangerous to species
survival than warming. After all, the interior of the frozen Antarctic
is nearly sterile of life whereas the Amazonian jungle in the hot steamy
tropics is teeming with it.
Second, the cause of the Permian extinction event is not yet settled and
is still highly disputed, the most favoured theory being that drastic cooling, not warming, killed off the many species.
Third, the media reporta cited the claims of the UN IPCC that the world might warm `up to 6°C' by 2100 due
to emissions of greenhouse gases like carbon dioxide. Even from the
twisted
perspective of the IPCC, the world is just as equally likely to warm by as little as
+1.5°C by 2100. It all depends on whether your sole focus is on a computer model worst-case scenario or
based on observed reality.
Trends of global temperature measured from satellites over the last 24
years show only a negligible warming trend globally, all of it in the northern hemisphere, with no warming at all in the southern hemisphere.
At that rate, there is no prospect of the +6°C warming ever happening.
Books on `global warming' always focus on the
worst possible outcome the authors can dream up. It sells more books that way.
That the claims are becoming progressively more extreme suggests it is the
global warming industry which is in danger of imminent extinction.
Clean Air? (22 Jun 03)
The Attorneys General of
Massachusetts, Connecticut and Maine have recently lodged a joint lawsuit
against the EPA to force it to regulate carbon dioxide emissions under
the Clean Air Act.
Why don't they lobby Congress
instead? According
to the Washington Times This would be the proper democratic thing
to do, not get their way via the back door through the courts.
They are doubtless aware that
there is a lack of public support for the Kyoto Protocol, or any policy that
imitates it. Carbon dioxide is a natural constituent of the atmosphere
and cannot be regarded as a `pollutant', thus excluding it from any definition
of `clean air', legal or otherwise.
Since climate is a global
matter, not a national one, three US states are not competent to dictate
national or international policy on climate. That is the legal
prerogative of the President acting with the `advice and consent' of the
Senate.
Open Letter to Canada's Likely Next Prime Minister
(5-25 June 03)
As the person almost certain to be Canada's next Prime Minister, Member of Parliament Mr. Paul Martin's recent condemnation
of his own government for their inept handling of the Kyoto file is especially significant. In the hopes that he will
instruct his staff to re-examine the science of Kyoto, 46 of the world's leaders in climate science sent him an open letter
that was published in The National Post on June 4, 2003. The letter was submitted to Mr. Martin by
Dr. Tim Ball, Canada's first PhD in climatology, who also included a cover letter that puts the open letter in context.
Click here for the open
letter
Click here for Dr Ball's cover letter
Click here for the Government Response and Dr. Ball's rebuttal
Click here for the latest Canadian Government spin on Kyoto
-
and the ensuing public dialog between Dr. Ken Green and the Government
New Scientist
`Revelations' (10 June 03)
New Scientist is a
long-standing champion of `global warming', ready to believe and publish the
wildest predictions of warming. Their latest effort
by their long-time greenhouse writer, Fred Pearce, on 4 June 2003, is titled `Global Warming's Sooty Smokescreen Revealed'. This article promoted a `think-of-a-number-and-double-it'
exercise from a climate workshop he attended in Berlin.
There, the gathered luminaries now
predict, not the IPCC's upper limit of +5.8°C (itself a
somewhat ridiculous figure), but have now bid it up to more than +11°C !
The excuse for taking the IPCC's upper
number and doubling it is their claim that sooty haze is actually cooling the
global climate, masking the warming that is really there simply waiting to
come out if the haze clears.
Let's think about that for a moment.
If we all do the right thing and make combustion cleaner, or even replace
combustion altogether, we will get warmer still as our cooling hazy blanket
disappears. What someone should have told these `scientists' at Berlin
is that we already have conclusive experimental evidence that their theory is
complete nonsense.
Look at the satellite temperatures of
the two hemispheres here. The satellite temperatures have seen the northern
hemisphere warm by +0.143° per decade since satellite temperature recording
began in early 1979 (this is well below the lower
limit of IPCC expectations). But the southern hemisphere has only
warmed an insignificant +0.007°C over the same period (completely
contradicting IPCC expectations).
Which hemisphere is the
sootiest?
Which has the most smoky haze?
It is the Southern Hemisphere which
is the cleanest, most free of sooty haze and associated aerosols, and it is
the Southern hemisphere which has seen no significant warming.
The Northern Hemisphere warming may well be caused by the haze
that is more prevalent there, not the other way around. If the northern
hemisphere haze is cleaned up, it is cooling we can expect there, not
warming.
The speculation of the Berlin `workshop' is
just that - wild speculation. That New Scientist should see this
as `Revelations' tells us more about New Scientist and their greenhouse
policy than about any serious treatment of evidence. `Revelations' are
for religions, not scientists. Maybe New Scientist can't tell the
difference any more.
Last Man Standing (9 Jun 03)
Now that the European Union, Japan and
Canada have signed onto the Kyoto Protocol, with the USA and
Australia opting out, all eyes are now on the `last man standing' - Russia.
The protocol cannot come into legal effect
until Russia ratifies it. If they refuse to do so, the protocol and all
the bureaucratic carbon trading structures it envisaged are dead.
Recent reports from Russia (here and here)
indicate a reluctance to ratify. Andrei Illarionov, The economic adviser
to President Putin is quoted as saying - "the
advantages of the Kyoto Protocol for Russia are somewhat illusory".
He added the final heresy of even doubting the theory of `global warming'
anyway.
Questions that were brushed aside by the
European Union, like `would the protocol actually do any good to the climate?'
were again raised by him, as were the costs. He said -
"I'm not convinced that
Russia can afford expenses that the world's richest country couldn't
afford."
It's hard to fault that
logic.
New Zealand Glaciers on the Move Again (6 June 03)
The Green lobby always claim `glaciers are shrinking
worldwide'. In fact, some shrink, some grow, and the key unifying cause
of any change in glacier mass seems to be, not temperature, but precipitation.
Reports from New Zealand (xtramsn.com.nz
and nzxsports.com)
say that their glaciers have started growing again after declining for a
few years after the 1998 El Nińo. There are some 40 glaciers in the
Southern Alps of the South Island and these have gained more ice in the last
year than they lost, mainly due to increased snowfalls at the head of the
glaciers high in the mountains, a part of a glacier known as an `accumulation
zone'.
The New Zealand
glaciers are rarely included in greenhouse industry datasets of `selected
glaciers' because they have that annoying habit of growing from time to time -
not what the industry wants to hear at all.
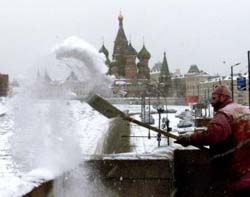
June Snow in Moscow (9 June 03)
According to the Italian Meteo Giornale
we have another weather event for the greenhouse theory to explain.
Snow in Moscow in June. In the article
in Italian it is said that the last June snowfall was 40 years ago in 1963.
This anomalous snowfall comes
at a time when Russia is being told by environmentalists that `global
warming' would be harmful to them. Yet Russians would be the last
people to be scared of a bit of warming even if some was on
offer. If it happened, it would open up vast areas of their inland to
agriculture, and open up the Northeast Passage to shipping.