The `Hockey Stick':
A New Low in Climate Science
by John L. Daly
![]()
"Whan that Aprille
with his shoures soote -
The droughte of March hath perced to the roote,
And bathed every veyne in swich licour
Of which vertu ungendred is the flour;"
- from The Canterbury Tales, by
Geoffrey Chaucer, 1386
"Our years are turned
upside down;
our summers are no summers;
our harvests are no harvests!"
- John King, an Elizabethan preacher,1595
Introduction
In 1995, the Intergovernmental Panel on Climate Change (IPCC) released its 5-yearly report on climate change [10], in a blaze of publicity, which contained the now infamous phrase that there was "a discernible human influence on global climate".
In their previous 1990 report [33], the IPCC illustrated their, then, understanding of how global climate had changed, not just during the previous 95 years, but also the past 1,000 years. In so doing they presented this graph (Fig 1.) of temperature change since 900 AD.
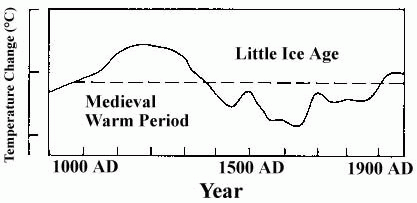
Fig.1 - Global temperature since 900 AD
This graph asserts that temperatures during the Medieval Warm Period were higher than those of today (as suggested by the opening lines to the Canterbury Tales by Geoffrey Chaucer), while it was much cooler during the Little Ice Age (as suggested by John King). Historical records from all over Europe, and Greenland attest to the reality of both events, and their profound impact on human society. For example, the colonisation of Greenland by the Vikings early in the millennium was only possible because of the medieval warmth. During the Little Ice Age, the Viking colonies in Greenland collapsed, while the River Thames in London often froze over, resulting in frequent `frost fairs' being held on the river ice.
The dating of these two climatic events depends to some extent on what one regards as `warm' and `cold' in comparison with present temperatures, but the following dating approximates these events -
1) `Medieval Warm Period' (AD
700 - 1300)
2) `Sporer Minimum' cool period (AD
1300 - 1500)
3) Brief climatic warming (AD 1500 - 1560)
4) `Little Ice Age' (`Maunder Minimum') (AD
1560 - 1830)
5) Brief warmer period (AD
1830 - 1870)
6) Brief cool period (AD
1870 - 1910)
7) 20th century warm period
(AD 1910 - 2000)
As to what caused these two major climatic events, the most probable candidate is the variable sun, particularly with respect to the Little Ice Age. This is because we have direct observations of sunspot counts going back to 1600 AD, which allows us to compare variations in the sun with variations to global climate. Fig.2 shows how the sun has changed over time, the radiation being greatest during a sunspot maximum and least during a sunspot minimum, both recurring on an 11-year cycle.
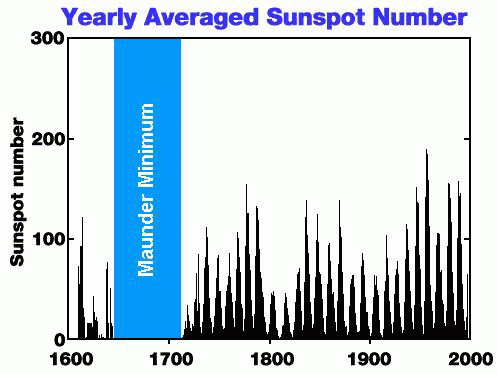
Fig.2 - The Solar Cycle since 1600 AD
The most striking feature of the above 400-year record of solar variability is the Maunder Minimum, a 70-year period on the sun in which there were practically no sunspots at all. It's as if the sun had `stopped breathing'. But even before 1640 when the Maunder Minimum started, the cycle was clearly fragmented and irregular in contrast with the solid rhythmic cycles of subsequent years after 1710. When we compare this extraordinary solar event with the climate record from Fig.1, we can see the Maunder Minimum occurred at exactly the same time as the lowest point of the Little Ice Age.
The inference is clear. The variable sun caused the Little Ice Age and in all probability caused the Medieval Warm Period too. Carbon 14 isotopes are used as a proxy for solar activity prior to 1600 AD and this indicates a high level of solar activity during the medieval period, resulting in climatic warmth, and also a reduced level of activity during a cold period called the `Sporer Minimum' centered around 1350 AD.
This account of climatic history contains two serious difficulties for the present global warming theory.
1) If the Medieval Warm Period was warmer than today, with no greenhouse gas contribution, what would be so unusual about modern times being warm also?
2) If the variable sun caused both the Medieval Warm Period and the Little Ice Age, would not the stronger solar activity of the 20th century account for most, if not all, of the claimed 20th century warmth?
Both propositions posed a serious threat to continued public acceptance of the climate modeller's catastrophic view of future climate. This is because new findings in solar science suggested that the sun, not greenhouse gases, were the primary driver of 20th century climate trends.
The power of the sun to modulate our climate has been reinforced by a large body of recent research that shows it is not only the cyclic warming and cooling of the sun (manifested by the 11-year sunspot cycle) causing our climate to change, but also changes in the solar spectrum towards greater ultra-violet radiation compared with visible or infra-red light (see Fig.3) [14] [8].
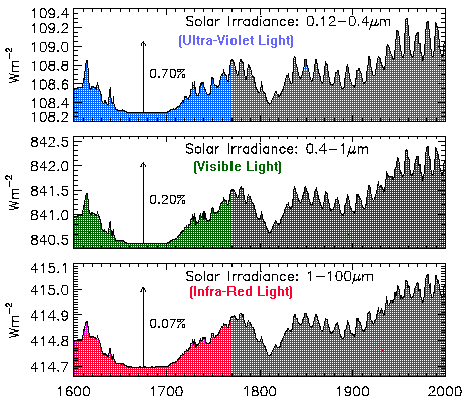
Fig.3 - The sun since AD 1600
The disproportionate enhancement of the ultra-violet part of the solar spectrum affects the ozone layer and other atmospheric chemistry, which may amplify any warming. In addition, recent changes to magnetic activity on the sun influence cosmic radiation reaching Earth which in turn modulates low level cloudiness and therefore temperature [24].
In other words, solar scientists have now identified three separate mechanisms by which the sun could warm or cool the earth, and it is these that are now believed to have been responsible for the Medieval Warm Period, the Little Ice Age, and the 20th century climatic trends.
These new solar findings were either ignored by greenhouse theorists or treated with hostility, since a warming sun in the 20th century would leave little or no room for trace greenhouse gases to be cited as an explanation for the claimed 20th century warmth.
In 1999, a new paper published in `Geophysical Research Letters' [15] altered the whole landscape of how past climate history was to be interpreted by the greenhouse sciences. It stood in stark contrast to the challenge posed by the solar scientists.
The infamous `Hockey Stick' was unveiled for the first time.
The `Hockey Stick'
Dr Michael Mann of the Department of Geosciences, University of Massachusetts was the primary author of the GRL paper, and in one scientific coup overturned the whole of climate history [16].
Using tree rings as a basis for assessing past temperature changes back to the year 1,000 AD, supplemented by other proxies from more recent centuries, Mann completely redrew the history, turning the Medieval Warm Period and Little Ice Age into non-events, consigned to a kind of Orwellian `memory hole' [22]. Fig.4 shows Mann's revision of the climatic history of the last millennium.
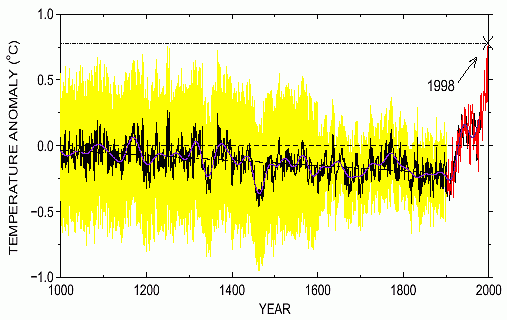
Fig.4 - The `Hockey Stick'
From the diagram, the Medieval Warm Period and Little Ice Age have disappeared, to be replaced by a largely benign and slightly cooling linear trend in climate - until 1900 AD.
At that point, Mann completed the coup and crudely grafted the surface temperature record of the 20th century (shown in red and itself largely the product of urban heat islands) onto the pre-1900 tree ring record. The effect was visually dramatic as the 20th century was portrayed as a climate rocketing out of control. The red line extends all the way to 1998 (Mann's `warmest year of the millennium'), a year warmed by the big El Niño of that year. It should be noted that the surface record is completely at variance with the satellite temperature record [20]. Had the latter been used to represent the last 20 years, the effect would have been to make the 20th century much less significant when compared with earlier centuries.
As a piece of science and statistics it was seriously flawed as two data series representing such different variables as temperature and tree rings simply cannot be credibly grafted together into a single series.
In every other science when such a drastic revision of previously accepted knowledge is promulgated, there is considerable debate and initial scepticism, the new theory facing a gauntlet of criticism and intense review. Only if a new idea survives that process does it become broadly accepted by the scientific peer group and the public at large.
This never happened with Mann's `Hockey Stick'. The coup was total, bloodless, and swift as Mann's paper was greeted with a chorus of uncritical approval from the greenhouse industry. Within the space of only 12 months, the theory had become entrenched as a new orthodoxy.
The ultimate consummation of the new theory came with the release of the draft of the Third Assessment Report (TAR-2000) [11] of the IPCC. Overturning its own previous view in the 1995 report, the IPCC presented the `Hockey Stick' as the new orthodoxy with hardly an apology or explanation for the abrupt U-turn since its 1995 report. They could not even offer any scientific justification for their new line.
Within months of the IPCC draft release, the long-awaited draft U.S. `National Assessment' Overview document featured the `Hockey Stick' as the first of many climatic graphs and charts in its report, affirming the crucial importance placed in it by the authors and by the industry at large. This is not an esoteric theory about the distant past, marginal to the global warming debate, but rather is a core foundation upon which a new publicity offensive on global warming is being mounted.
Two issues are raised by Mann's `Hockey Stick'.
1) Why did the climate community fail to critically
review the validity of the new theory,
indeed to uncritically embrace it in its
entirety?
2) Is any of it true? Or is it a means of disposing
of the inconvenient Medieval Warm Period
and Little Ice Age, and thus avoid the problem
of the role of the sun in climate history?
The Origins of the `Hockey Stick'
Tree rings are the primary proxy behind the `Hockey Stick', particularly the earlier part of the millennium. Tree rings are only laid during the growing season, not the whole year, and so they tell us little or nothing about annual climate. For example, this year (2000) there was a warm winter and early spring in the north-eastern USA, followed by an unusually cool summer and fall. Since the two events are largely self-cancelling, the year may finish as fairly average, but the tree rings would only record the cool summer and thus give a completely false impression of the full-year temperature. Tree rings do not even record night temperatures since photosynthesis only occurs in the daytime. Yet winter and night temperatures are an essential component of what we understand by the concept `annual mean temperature'.
All a tree ring can tell us is whether the combined micro-environmental conditions during the growing season were favourable to tree growth or not. This is because tree rings are influenced by numerous factors other than temperature, such as rainfall, sunlight, cloudiness, pests, competition, forest fires, soil nutrients, frosts and snow duration. Thus they are not even a good daytime temperature proxy for the few months of the growing season. Other proxies such as isotopes in coral, ice, minerals and sediments are vastly superior.
Trees only grow on land. Since 71% of the planet is covered by oceans, seas and lakes, tree rings can tell us nothing about the maritime climate, even though the oceans are known to be the prime determinants of climate conditions throughout the world.
In other words, historical climate simply cannot be described without taking into account the winter and adjacent months temperatures, night-time temperatures, and ocean sea surface temperatures. Tree rings, no matter how carefully they are measured and examined, cannot provide information on any of these key parameters, and are a doubtful proxy even for daytime temperatures on land in summer.
A final weakness arises when calibrating the tree rings against temperature. When measuring the width or density of a tree ring, exactly what temperature is represented by that measurement? This can only be determined by calibrating recently laid rings against known temperatures that existed at the time. Even this is problematic as the `known temperatures' can mean using a temperature series seriously contaminated by heat island and other local errors. If the calibrating temperatures are wrong, the whole tree ring temperature reconstruction for the distant past is also compromised.
There are many sub-specialties within the greenhouse sciences, `dendrochronology' (study of tree rings) being one of them. That particular sub-branch has both prospered and been highly successful in projecting itself to the broader climatic community on the basis of what is a very weak proxy.
In respect of Europe and Greenland, the IPCC and `National Assessment' do not challenge the existence of the Medieval Warm Period and Little Ice Age as they are too well recorded in other proxy indicators and historical accounts of the time. Instead, these events are now presented as being purely local to Europe and Greenland, but completely absent elsewhere in the world.
In general, the greenhouse industry disregards historical evidence, claiming them to be merely `anecdotes'. However, the idea that historical evidence can be easily dismissed as `anecdotes' in favor of questionable proxies like tree rings is to suggest that professional historians cannot be trusted to be objective.
Objectivity comes from how the evidence is treated, not the nature of the evidence itself. Historians can be just as objective as any scientist. Indeed most of them regard their work as science. As a prominent Finnish scientist remarked about a historical military event in his country's distant history, "if `anecdotal' ice is thick enough to carry a whole army, we can infer the ice was both thick and durable as an objective conclusion based on a documented historical fact."
Similar inferences can be made elsewhere in the world. For example, if whole populations suffered from drought-induced famine, we can infer a reduced rainfall. We don't need the proxies to tell us - indeed they might even mislead us. When a society is ravaged by great floods, we can infer increased precipitation. When the Polynesians were able to populate the Pacific Islands by outrigger boats, we can make climate inferences there too.
The fact that the greenhouse sciences were reluctant to declare the Medieval Warm Period and Little Ice Age as non-events in Europe suggests that the historical evidence was too overwhelming to make selected proxies believable. Such a claim for Europe would have been met with derision. While greenhouse science may regard proxies as being more objective than historical `anecdotes', that viewpoint is only shared among that peer group. The wider academic community, governments, and public opinion (the most important peer group of all) will give much more credibility to well-researched historical evidence.
If the IPCC were genuine about the need for full information about millennial climate, they would involve historians everywhere to research their resources to determine past climates as observed and experienced by human societies. The fear of some global warming proponents is that the historians would indeed find the Medieval Warm Period and Little Ice Age all over the world and that governments and public opinion would accept the historical accounts over tree rings.
In Mann's original formulation, the `Hockey Stick' only applied to the Northern Hemisphere. However, the U.S. National Assessment treated it as if it were a global history by reproducing Mann's original graph with a new title implying it has global rather than hemispheric application [19]. This revised version of Mann's graph is shown in Fig.5.
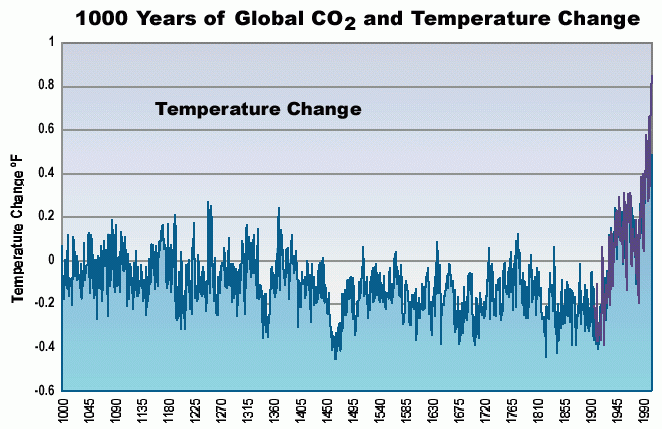
Fig.5 - The `Hockey Stick' according to the U.S. `National Assessment'
Apart from the subtle `globalisation' of the graph in the title, this version omits the wide error margins that were included with the original Mann graph (Fig.3), shown in yellow. These error margins were the only indication by Mann that his formulation could be wrong, conceding in his paper that the pre-1400 data was uncertain. The idea that global temperature 1,000 years ago could be calculated to an accuracy of 0.1°F based on a limited number of tree rings is simply not credible by any reasonable standard.
The `National Assessment' disregarded these issues and threw its full weight behind the new theory with this stark assertion.
"New studies indicate that temperatures in recent decades are higher than at any time in at least the past 1,000 years." - (NACC Overview p.11)
Mann himself made a similar conclusion in his original paper with these concluding remarks in the abstract to his paper -
"Our results suggest that the latter 20th century is anomalous in the context of at least the past millennium. The 1990's was the warmest decade, and 1998 the warmest year, at moderately high levels of confidence".
The statement was dramatic and uncompromising, with barely a hint of the uncertainties inherent in his whole analysis. There was no dissent - except from those scientists who were already on record as being sceptical of global warming anyway. The final claim, that `1998 was the warmest year of the millennium' was exactly what the climate change industry wanted to hear in the run-up to the next round of conferences on the Kyoto Protocol.
The `Hockey Stick' - True or False?
To disprove the `Hockey Stick', it is sufficient to merely demonstrate conclusively the existence of the Medieval Warm Period and/or the Little Ice Age in proxy and/or historical evidence from around the world. According to the `falsifiability' principle of science, substantial physical evidence that contradicts a theory is sufficient to `falsify' that theory. To that end, `exhibits' of physical evidence are presented below to prove that not only is the `Hockey Stick' false, but that the Medieval Warm Period and Little Ice Age were not only very real - but also global in extent.
Exhibit 1 - The Sargasso Sea
In the Sargasso Sea (an area popularly known as the `Bermuda Triangle'), radiocarbon dating of marine organisms in sea bed sediments by L. Keigwin [12] demonstrates that sea surface temperatures were around 2°F cooler than today around 400 years ago (the Little Ice Age), and around 2°F warmer than today 1,000 years ago (the Medieval Warm Period). In addition, the data also demonstrates that the period before 500 BC (the so-called Holocene Climatic Optimum) saw temperatures up to 4°F warmer - and without any greenhouse gas component to cause it. (See Fig.6 below)
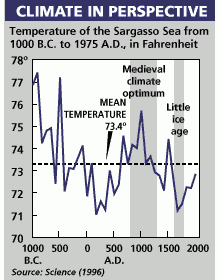
Fig.6 - 3,000 years of climate in the Sargasso Sea [x]
That takes both key events well outside the European/Greenland region.
Exhibit 2 - Caribbean Sea
Measurements of oxygen isotopes in coral skeletons from Puerto Rico by Winter et al [32], compared modern isotope ratios with those of the distant past. Calibration of the coral isotopes to provide a sea surface temperature proxy was based on modern sea surface temperature records around Puerto Rico for the period 1983-1989. This provided the baseline for the researchers to test the coral for temperatures during known cold phases of the Little Ice Age, 1700-1710, 1780-1785, and 1810-1815. They found that during the Little Ice Age, sea surface temperature in the Caribbean was 2 - 3°C cooler than it is today, a truly massive reduction in temperature which could by no stretch of the imagination be local.
Exhibit 3 - West Africa
In an ocean drilling study off Cap Blanc, Mauritania, West Africa de Menocal et al [6] recovered ocean bed sediments from which various mineral and biological proxies were examined. According to their paper -
"A faunal record of sea-surface temperature (SST) variations off West Africa documents a series of abrupt, millennial-scale cooling events, which punctuated the Holocene warm period. These events evidently resulted from increased southward advection of cooler temperate or subpolar waters to this subtropical location or from enhanced regional up-welling. The most recent of these events was the Little Ice Age, which occurred between 1300 to 1850 A.D., when subtropical SSTs were reduced by 3° to 4°C." - deMenocal et al. abstract
The result was a profile of ocean temperature going back 2,500 years very similar to that acquired from the Sargasso Sea. Both the Medieval Warm Period and Little Ice Age were strongly evident as demonstrated by Fig.7. In fact, deMenocal et al identified two periods of colder climate coinciding with two similar cold periods revealed in the Sargasso Sea.
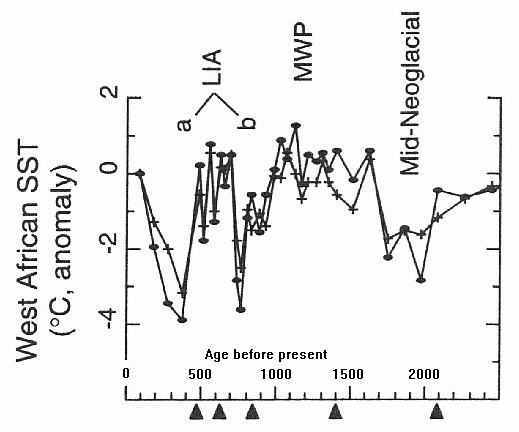
Fig.7 - Sea Surface Temperature off West Africa, last 2,500 years
That places the Medieval Warm Period and Little Ice Age as existing throughout the North Atlantic Basin, from the tropics, to the Americas to Europe and the far North Atlantic to Greenland. That represents a huge slice of the northern hemisphere, making it virtually impossible that climate elsewhere in that hemisphere could negate the effect of those events in any hemispheric average.
Exhibit 4 - Kenya, East Africa
In Kenya, a study by Verschuren et al [29], extracted lake bed sediments from Lake Naivasha. According to their paper -
"Our data indicate that, over the past millennium, equatorial east Africa has alternated between contrasting climate conditions, with significantly drier climate than today during the `Medieval Warm Period' (~AD 1000-1270) and a relatively wet climate during the `Little Ice Age' (~ AD 1270-1850) which was interrupted by three prolonged dry episodes." - Verschuren et al abstract
They determined historical lake level and salinity measurements from proxy indicators in the lake bed sediments. The results are shown in Fig.8
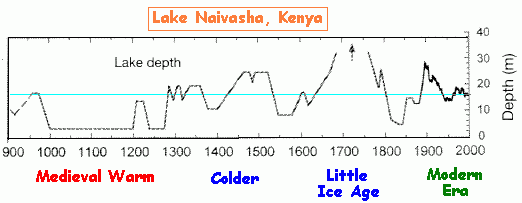
Fig.8 - Climate change at Lake Naivasha, Kenya
Here we see the main Little Ice Age of the late 1600s and 1700s, confirmed by the Sargasso and Cape Blanc data. During the Medieval Warm Period, the lake clearly endured a period of extended drought from 1000 to 1200 AD. Today the lake level is about half-way between these two extremes, suggesting that our present climate is poised about mid-way between these two historic extremes.
Exhibit 5 - Quelccaya Glacier, Peru
Ice cores from this glacier high in the Peruvian Andes yielded oxygen 18 isotopes which are a direct proxy for temperatures existing at the time the ice was laid down [23]. The Little Ice Age stands out clearly, and while the Medieval Warm Period is less pronounced than at other sites, the 20th century is clearly shown to be no warmer than existed in pre-Little Ice Age times. Indeed, some of the medieval temperature peaks are warmer than those of today. See Fig.9

Fig.9 - Oxygen Isotopes from the Quelccaya Glacier, Peru
Since Peru is in the Southern Hemisphere, we have direct evidence at this site that these climatic events extended beyond the confines of the Northern Hemisphere.
Exhibit 6 - Taiwan and China
In Taiwan, Kuo-Yen Wei et al. performed lake sediment studies similar to those in Kenya, which again revealed the imprint of the Medieval Warm Period and Little Ice Age [13]. According to their summary -
"The interlaminated dark and light colored lake sediments obtained from several mountain lakes appear to reflect large-scale wet and dry cycles over the past 2400 years (Chen et al., 1993; Lou et al, in press). The detected 450-years periodicity is similar to that of the solar oscillation. The Medieval Warm Period (1000-1300 AD) and the Little Ice Age (1300-1850 AD) were recognized (Lou et al., in press). These two epochs were also identified from palynological records from the Central Range (Liew et al., 1995)"
They also referred to studies of annual to seasonal records from tree-rings
"Studies of tree rings of Taiwan fir allowed to reconstruct past summer and winter temperatures of the alpine mountain area during the past 300 years. It is demonstrated that cold climate prevailed during the Little Ice Age (Tsou and Liu, 1995)."
Finally in a synopsis of the various proxies studied in and around Taiwan -
"During the past 2000 years, the climate has become warmer and wetter, intervened with the conspicuous Medieval Warm Period (1000-1300 AD) and the Little Ice Age (1300-1850 AD). Tree-ring data confirmed also the effect of the Little Ice Age in alpine Taiwan mountains. Fluctuation of humidity over the past 2,400 years as derived from lake sediments suggests that the recognized dry/cold periods coincide with major historical commotion events in Chinese history."
The verdict from Taiwan is thus conclusive. From a variety of proxy indicators, the same events are found even here, on the western rim of the Pacific Ocean.
The Taiwan researchers even linked major `commotion events' in mainland China with these climatic events. According to Hong et al. [9] these events were also climate driven. Their study of oxygen isotopes in a peat bog in north-eastern China close to the border with North Korea, revealed a 6,000 year temperature history which was compared with carbon 14 solar proxies to match the temperature history with solar change.
They estimated the temperature between 1100 and 1200 AD at around 2°F warmer than today, matching the Medieval Warm Period, confirmed by the existence at that time of plant remains from species that normally exist only in southern China. They found very cold temperatures between around 1550 and 1750, matching the Little Ice Age found elsewhere.
Finally, they too found the solar connection in these climate changes, the carbon 14 solar proxy correlating with the oxygen 18 temperature proxy. In other words, the sun caused climate changes in China.
Exhibit 7 - Japan
With the Medieval Warm Period and Little Ice Age clearly evident in Taiwan and China, the appearance of the same events in Japan would provide useful validation. Ironically, most of the proxy and historical evidence comes from none other than Kyoto itself, the ancient capital of Japan. According to a study by Tagami [26]
"On the Medieval Warm Period.
It is not doughty [doubted? - J.D.] that there was a warm climate age in historical times of Japan. Many former studies, e.g. the study on the changes of cherry-blossom-viewing date in Kyoto, show the warm climate around the early this millennium. But they are not clear when the warm climate began and when it ended. And also they are not clear how it relate to the climate situation in other areas. In this study, climate in the Medieval Warm Period of Japan is reconstructed and also its condition is compared to that of other areas.
Processing databases and the analysis
Mainly the historical documents are used in this study. The data which are chosen from them are classified into two types. One is a seasonal climate type from the 7th century and the other is a daily weather type from the 10th century. The former type data are climatic hazards, unusual weathers, cherry-blossom-viewing dates, lake freezing dates and so on. The climatic hazards were drought, long rain, heavy snow, mild winter and so on. The latter type data are described in private diaries of nobles who lived in Kyoto. The databases have been prepared for the both type of them. And using the databases, climate around the Medieval Warm Period is reconstructed. It is as following way: first, seasonal climate charts are drawn, then climate condition of each season is examined. …
Some remarks on the climate of the Medieval Warm Period
As the results, some characteristics of climate are recognized around the Medieval Warm Period. However it is relatively hot conditions continued until the 8th century, cool condition appeared for short period in the late 9th century. Then warm conditions continued from the 10th century to the former half of the 15th century. After the latter half of 15th century, cool conditions appeared and then considerable cold conditions started from the 17th century. So, between the former and the latter cold ages, the warm condition is clear from the 10th century to the 14th century."
The conclusions from this study underline the importance of not allowing a Euro-centric view of science to blind scientists to valuable work being done in non-western countries. In spite of the halting English used (thus the need to quote at length from it), the conclusion from Japan is clear and unambiguous - there was a Medieval Warm Period and a Little Ice Age, and they occurred at exactly the same times as found elsewhere in the world.
A paper by J. Magnuson et al on freeze/melt dates for lakes and rivers around the world [15] gives further evidence of the Little Ice Age in Japan with data for freeze dates on Lake Suwa, in which earlier freeze dates indicate a cold climate, later freeze dates a warmer climate. Lake Suwa has the longest record of freeze dates in the study, with data going back to 1443 AD, almost three times longer than for any other water mass in the study.
It too shows the impact of the Little Ice Age, as according to Magnuson et al.
"Lake Suwa was ice covered for 240 out of 243 winters (99%) from 1443 to 1700, but only for 261 out of 291 winters (90%) from 1700 to 1985".
The earlier `99%' period was right within the Little Ice Age.
Exhibit 8 - Tasmania, Australia
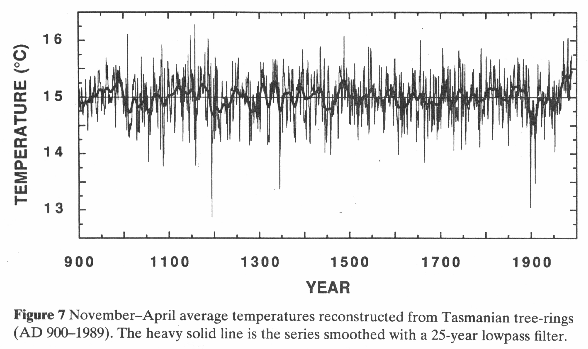
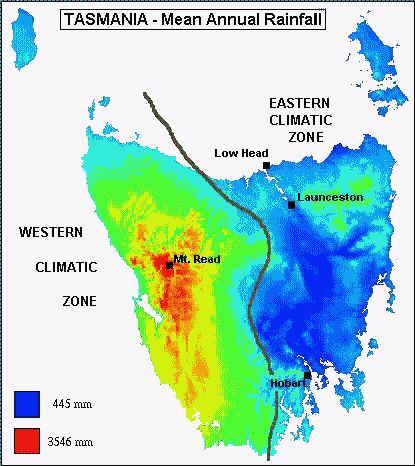
Tasmania is an island state of Australia, about the size of Maine, deep in southern latitudes. In this exhibit, we not only find confirmation of the Medieval Warm Period, but also obtain some insight into the origins - and the flaws - inherent in the `Hockey Stick' itself.
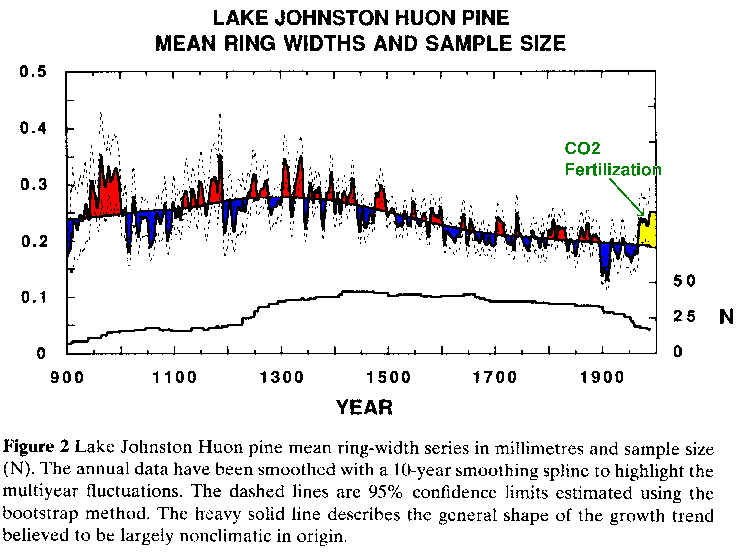
Ed Cook, a prominent tree ring researcher, has been a frequent visitor to Tasmania over the past 10 years, taking tree ring samples from a unique species of long-lived softwood known as `Huon Pine' (Lagarostrobos Franklinii), some of the living trees being over 1,000 years old. Due to Tasmania's remoteness south of the Australian mainland, Cook's papers did not receive the critical examination they warranted, as there were flaws in both his handling of local data and in his conclusions.
To calibrate the tree rings against temperature, Cook and his team used urban surface temperature records from the dry eastern half of the island to compare with tree rings taken from the wet western half, even though there were rural surface records in the west from which a more valid comparison could have been made. In his earlier studies, no allowance was given to the Fertilizer Effect of CO2, making his conclusions about recent decades invalid.
Back in 1992, seven years before Mann's paper appeared, Ed Cook was the co-author of a paper in `Holocene' [3] in which a time series of Huon Pine tree rings going back to 900 AD was presented. Here is a scan of a graph he presented (colour added for emphasis and clarity).
