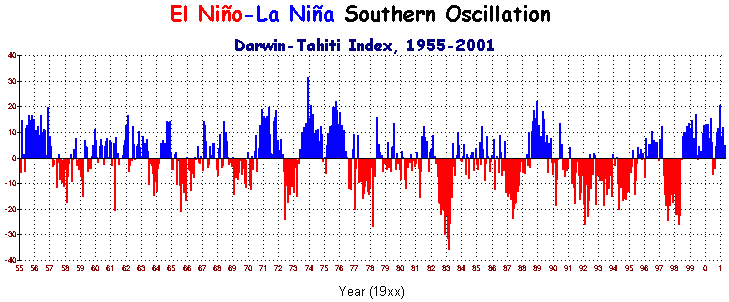
| The dominance of El Niņo since the late 1970s will inevitably warm
the oceans anyway as El Niņo is itself a natural ocean warming
phenomenon, particularly in the Pacific. It should be no surprise to find that
warming effect appear in
the observational record. In the last 3 years, La Niņa has
reasserted itself, but too late for the period of study covered
by the two papers. As
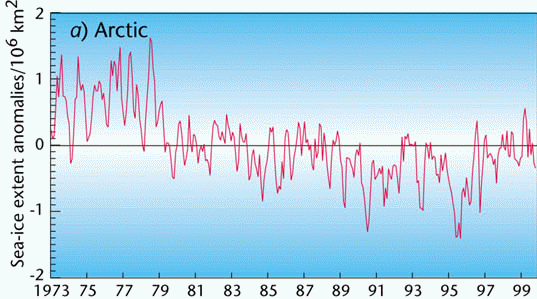
for sea ice thickness, this has seen some decrease since the 1950s, again
consistent with the 1950s being anomalously cold (probably
due to the dominance of La Niņa), thus giving another distorted
view of trends when the start date is anomalous. However, the 40% decrease
in ice thickness claimed by Levitus et al is well off the mark and
itself based on some faulty assumptions relating to inter-annual
variability of sea ice thickness [9]. A full discussion of
Arctic sea ice extent and thickness history is presented here [3]. Rubbery assumption no.4.
And just how much warmer did the oceans become? That's where
Barnett et al. enter the story...
Where Barnett et al. went wrong
The Barnett team also examined ocean temperature
data since 1955, most of it for the North Pacific and North Atlantic
where data sources were considered by the authors to be sufficient. They presented a picture of
overall warming for those two basins between 1950 and 1995 of up to
+0.15°C at depths to 500 metres, +0.1°C to depths of 1,000 metres, and
+0.05°C to 2,000 metres. These results were hardly news, having
been published a year earlier by Levitus [7]. It should be
remembered that ocean temperatures away from the tropics change many
degrees due to seasonal forcing alone, while the Decadal Pacific
Oscillation (PDO) and the El Niņo-La Niņa
Southern Oscillation (ENSO) also impose
temperature changes of similar magnitude in the Pacific. The North
Atlantic Oscillation (NAO) does the same in
the North Atlantic [10].
All these are natural phenomena unconnected with human activity. Barnett's
primary purpose
in the paper was not to merely repeat the work of Levitus a year earlier
in presenting a picture of trace warming in the oceans, but rather
to match that warming with the new Parallel Climate Model to see if the model could reproduce the
same trend if forced with the same input of greenhouse gases which we
know has happened over the last 4 decades. Although the model was
forced with these gases, it was not forced with any other known
external input - nothing from the volcanoes, nothing from ENSO, PDO, or
the NAO, and nothing from the Sun. In other words, the model was
only allowed to run with internal forcings (ocean
currents, seasonal changes etc.) and the only external forcing
included was the trace gases from human activity, mainly CO2
and also the assumed (but
unproved) effect of direct sulfate emissions. The Parallel Climate Model is not a single model per
se. It is actually a mega-model made up from separate models. The
atmospheric component of PCM is the CCM3 model at NCAR in Boulder.
The University of Texas model provides the rivers component, the
Parallel Ocean Program model provides the ocean component, finally a
sea-ice model at the Naval Postgraduate School represents the cryosphere. Naturally, the model produced just the result expected,
particularly since the model used the same questionable assumptions about the
temperature effects of CO2 since its atmospheric
component came from the NCAR model,
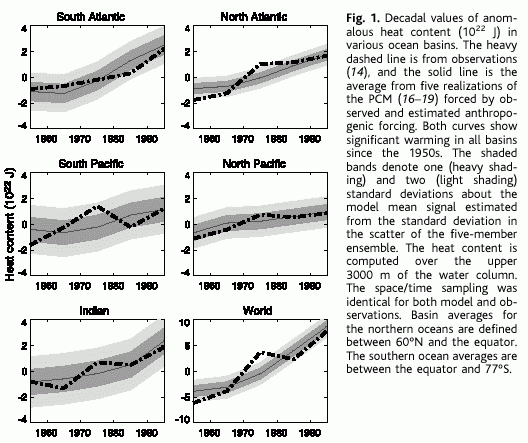
but which has never been proved by observation. The model's ocean temperature trend
approximately matched the observed trend reported by Levitus
in 2000, albeit with an unexplainable discontinuity around
1970-1980.
 |
The results of the model run
matched against observations are shown left.
Since the model roughly tracked the
temperature trend, the authors concluded that this model better
represented climate change than any other model. Since the model
produced that result through greenhouse gas forcing, they
reasoned that the observed ocean warming must therefore have been produced
in exactly the same way.
This is closed logic. |
The model was constrained so that the only
external forcing it could react
to was greenhouse gases and aerosols - the sensitivity and magnitude of that response
defined by the NCAR CCM3 atmospheric model. They did not include
key forcings such as the Sun and El Niņo, nor did they include in the
forced model runs for detection other man-made inputs such as indirect sulfates, aerosols, smoke, or ozone.
By excluding these other forcings, of course the PCM produced the
expected
result. How could it do otherwise? As
an analogy, it's like pumping up a balloon with air and noting that the balloon expands.
The closed logic comes if we then attribute all subsequent occasions of balloon expansion to air being
pumped in, when we know full well that additional heat or a fall in external
air pressure can have exactly the same effect. In other words, the
equations `air pumped in' equals `expansion', while
`expansion' equals
`air pumped in' excludes by definition any other external variable - an
example of closed logic where the two allowed variables prove the
existence of each other in a closed system. The
oceans are not a closed system. Ocean temperature also responds to all the other
forcings, but
which were excluded by the PCM model so that greenhouse gases
could get an unimpeded `clear run'. The authors got the result
they expected by accepting a set of model conditions which
favoured that outcome, and then proceeded to announce they had `proved'
an anthropogenic fingerprint. They had done nothing of the kind. Had the model been forced with ENSO or PDO or NAO or
the volcanoes or the Sun (or all of them),
but without the greenhouse gas forcing, much the same result would have been
achieved because all these other forcings have also affected
ocean temperature during the same 40 year period, mostly toward slight
warming, exactly what has been observed. The model
validation experiment might have been more credible had all
external forcings been incorporated, just as the real climate has to
cope with all forcings, both internal and external.
 |
In their quest to
validate this new mega model, Barnett et al. dropped the rest of the
greenhouse industry in `deep water'. In spite of being
limited to give a clear run to greenhouse gases only, the
Parallel Climate Model
still produced a warming slightly higher than the observed
data. Worse still, having announced the model as validated
by the observations, they proceeded to attack the credibility of
all other models as shown in the quote
(left) from their paper.
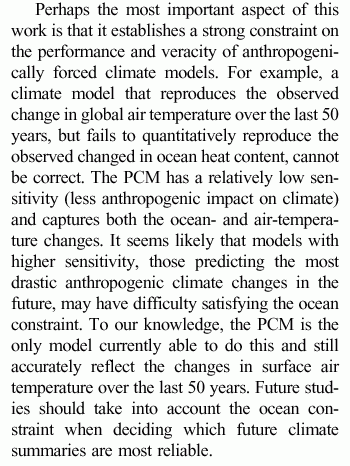
They state the PCM has a `relatively low
sensitivity', hardly surprising given that the model was
required to reproduce the observed ocean temperature. Having achieved that with a low sensitivity,
thereby involving a much smaller theorised human impact on climate, the validity of
the model could only be affirmed by a direct attack on the other
models in current use, particularly those with higher
sensitivities and yielding the largest warmings. The
worst-case IPCC scenario of a 6°C warming by 2100 is clearly in that
league, and Barnett et al. undermined the credibility of
these IPCC scenarios in an attempt to prove the worth of the PCM
model. |
Conclusion
These papers, like many before them, were trumpeted
by the media as cutting the legs from under the arguments put by
greenhouse sceptics that the warming from greenhouse gases will only be
very slight (measureable in only tenths of a
degree, not whole degrees), and that most studies reporting real
or imagined warming trends in the atmosphere, oceans, or cryosphere,
reveal serious flaws in the statistical treatment of the data, and/or in
the methods of collecting that data.
These two papers are little different. The
Levitus paper makes so many bland and questionable assumptions that
their calculation of global heat gain is highly questionable as serious
science. The Barnett paper merely repeats the earlier work of
Levitus in reporting a slight warming in the ocean, a warming which can just as easily
be attributable to PDO, ENSO, NAO, volcanoes, and/or the
Sun. The only way they could target greenhouse gases as the cause
of this miniscule warming was to exclude these other variables from the Parallel Climate Model. In doing so,
they neither proved the accuracy of the ocean warming reported earlier
by Levitus, nor the validity of the model.
But greenhouse sceptics were doubtless amused to
see Barnett et al. proceed to attack all the other models,
claiming they were showing much too large a human impact due to
excessive model sensitivity. Having taken the small observed ocean
warming as the baseline for the sensitivity settings of the Parallel
Climate Model, there could be no other conclusion - the other models
were wound up much too high and giving much higher predicted temperature rises
than the oceans would allow.
If anything, the Barnett paper affirms what
sceptics have been saying all along, that human impact will be very
small and that the present scary predictions by the IPCC are
scientifically unsupportable. Unfortunately, the media rarely
reads past the abstract of such papers.
Update 1 May
2001: As a point of clarification, it has been pointed
out in email correspondence that the PCM model was forced with sulfate
aerosols in addition to the greenhouse gases already mentioned.
The Barnett paper is ambiguous on this point as it states in one part of
the paper that the direct effect of such aerosols was included, but then
two pages later said that `the forced runs used for detection did not
include indirect sulfate, ozone, so-called black aerosols, and other
anthropogenic factors, not did they include external forcing due to
solar variability and volcanic activity.' The ambiguity would
therefore hang on the definition of `direct' and `indirect'
anthropogenic aerosols.
Given that the assumed cooling effect of
sulfate aerosols is still only a theory, the fact that the sulfate-free
southern hemisphere has not warmed at all since satellite temperature
measurement of the lower troposphere began in January 1979, while the
sulfate-rich northern hemisphere has seen a slight warming (a decadal trend of +0.113°C), suggests that the
theory lacks substance. Had it been otherwise, the southern
hemisphere would have warmed relative to the northern.
It was also a point of discussion as to
whether El Nino, the North Atlantic Oscillation, and the Pacific Decadal
Oscillation (none of which were included as
forcings in the PCM model) were `external' or `internal' forcings
to the climate system. Given that one of the guest authors on this
website, Dr Theodor Landscheidt, has demonstrated that all three of
these major climate oscillations are closely correlated with solar
activity and motions, it is therefore considered for the purposes of
this review that these oscillations are indeed `external'. For more
information on this solar connection to the three major oscillatioins,
see Landscheidt's papers on El NIņo,
on the NAO, and on the PDO.
References
[1] Australian Mean Sea Level
Survey, National Tidal Facility, Adelaide.
http://www.ntf.flinders.edu.au/TEXT/PRJS/BASE/meansea.html
[2] Barnett, T. et al., "Detection of Anthropogenic Climate Change in the
World's Oceans", Science, vol.292,
p.270-274, 13 April 2001 [3] Daly, John L., "The Top of the World:
Is the North Pole Turning to Water?, 2000,
http://www.john-daly.com/polar/arctic.htm [4] Daly, John L., "Moby
Dick's Revenge". 1997, http://www.john-daly.com/mobydick/mobydick.htm
[5] de la Mare, William
K., 1997, "Abrupt mid-twentieth-century
decline in Antarctic sea-ice extent from whaling records"
Nature, vol.389, pp 87-90, 4 Sept 97
[6] Hecht, Jeff, "Warm
Water", New Scientist, 15 Apr 2001,
http://www.newscientist.com/dailynews/news.jsp?id=ns9999631
[7] Levitus, S. et al.,
Science vol.287, p.222, 2000
[8] Levitus, S. et al., "Anthropogenic Warming of Earth's Climate
System", Science, vol.292, p.267-270, 13 April 2001
[9]
McLaren, A. et
al., "Variability in Sea-Ice Thickness over the North Pole from 1977 to 1990",
Nature, v.358,
p.224, 16 July 1992
[10] NAO winter index chart -
http://www.cru.uea.ac.uk:80/~timo/projpages/nao_update.htm
[11] National Assessment Synthesis Team
(NAST), "Climate Change Impacts on the United States: The Potential
Consequences of Climate Variability and
Change" - Overview document, USGCRP, June 2000
|


