The
Greenhouse Effect
The earth’s temperature today is modified by the presence in the atmosphere of several gases which are capable of absorbing part of the infra red radiation that is given off by the earth, and re-radiating part of it back again (Figure 1.2). Without these gases the mean surface temperature could be 33°C less than it is today. The most important gases are water vapour, carbon dioxide , methane, ozone, halocarbons and nitrous oxide. In addition to these gases there are similar effects due to aerosols, amongst which are ordinary clouds, dust, and carbon (soot) Any changes in these gases and aerosols will alter the thermal balance in the atmosphere, and so the mean temperature of the earth. The recent increase in the concentration of the minor greenhouse gases has led to the belief that there has resulted an increased mean global temperature, the “enhanced greenhouse effect”. As has been shown in the previous chapter, however, there is no evidence, so far, that this is happening. The extra radiation said to be due to the enhanced greenhouse effect is called “radiative forcing” by the IPCC. Water
Vapour
Tyndall
(1)
regarded water vapour as the dominant greenhouse gas.
He wrote that water vapour “acts more
energetically upon the terrestrial rays than upon the solar rays; hence,
its tendency is to preserve to the earth a portion of heat which would
otherwise be radiated into space” . Baliunas and Soon (2 )
recently calculated that
water vapour is responsible for about 88% of the absorption of infra red
radiation from the earth in the 4
to 60 micron wavelength
range.. As
the main greenhouse gas it is unlikely that there will be any evidence
of an “enhanced greenhouse effect” or of “radiative forcing”
unless it can be shown that the amount and
distribution of water vapour in the atmosphere is changing in
such a fashion as to increase the greenhouse effect. Unfortunately there
is no such record. Water vapour concentration in the atmosphere is
highly variable over several orders of magnitude both locally,
temporally and with height. There are simply no past or present records
which could help to decide whether its radiation properties have changed
or are changing. There are a number of papers which have found evidence
from satellites of recent increases in water vapour in the upper
atmosphere (3,4).
However, Lindzen (5,6) has
pointed out that it does not follow that this effect pervades the
atmosphere, or is related to the behaviour at the surface, which we have
seen in Chapter 3, has no firm evidence for a warming. Rind (7)
in discussing Lindzen’s objections, concedes that “Unfortunately
we do not have the observations in place to be able to do so (give a
proper figure for the water vapour feedback) and it is not clear when we
will” Climate Change 01 (8)
says "Raval
and Ramanathan’s results
(3)
are difficult to interpret as they involve the effects of circulation
changes as well as direct thermodynamic control” They make similar reservations about the results of Inamdar and Ramanathan (9) “it still cannot be taken as a direct test of the feedback as the circulation fluctuates in a different way over the seasonal cycle than it does in response to the doubling of CO2 “ (8) The mere existence of water vapour as a greenhouse gas is simply omitted from Chapter 4 “Atmospheric Chemistry and Greenhouse Gases” of Climate Change 01 (10) It does not include tropospheric water vapour as part of “atmospheric chemistry”. The Chapter (11) begins its “Executive Summary” with “Currently, tropospheric O3 is the most important greenhouse gas after CO2 and CH4”. Water vapour does not exist! Chapter 6 “Radiative Forcing of Climate Change” (12) also fails to mention water vapour. The excuse usually given for this neglect is that water vapour is relegated to the status of a “feedback” where its unknown effects can be guessed in the form of a parameter proportional to the calculated temperature. A possible theoretical treatment is the Clapeyron equation dp/dT = l/ T(v2 - v1) where p is the vapour pressure, T the absolute temperature, l is the latent heat,
v2 the volume of vapour, v1, the volume of liquid. dp/dT = pl/RT² which deals only with vapour pressure, but in addition to assuming the atmosphere is in equilibrium (which it is not), also assumes that water vapour behaves as an ideal gas (which it does not). Climate Change 01 (13) downplays the importance of this equation, as follows : “In the SAR, a crude distinction was made between the effect of “upper-tropospheric” and “lower-tropospheric” water vapour, and it was implied that lower tropospheric water vapour feedback was a straightforward consequence of the Clausius-Clapeyron relation. It is now appreciated that it is only in the boundary layer that the control of water vapour by Clausius-Clapeyron can be regarded as straightforward” At first glance, it seems reasonable that the vapour pressure of water ought always to increase with temperature., even when not in equilibrium, although Lindzen has argued that this is not necessarily so (6). But when it is appreciated that part of the water vapour is involved in the formation of clouds, it no longer seems so reasonable. Clouds
Along
with our ignorance on the historical and current concentration and
distribution of water vapour, we are equally ignorant about the past or
even the present behaviour of clouds. Cloud formation is extremely
complex, and the radiative behaviour of clouds depends on the type of
cloud and its location. This unpredictable and unknown
behaviour is, of course, dealt with by guesswork, an assumption
of cloud “feedback. Although water vapour guesses in climate
models are relatively uniform, those for clouds represent the greatest
source of the difference between climate models, as is shown by various
intercomparison studies (14,15,16,17).
There is evidence that “cloud cover” (however
measured) has increased over the years (18)
but there is no information on the different types of cloud.. So maybe
any temperature increase is nullified by increased clouds? Comprehensive
measurements of clouds by satellite have been made since 1983 (19),
but there is no evidence of any consistent trend. Other
Effects of Water
Precipitation,
whether of rain or snow, also affects climate, and we have little
reliable or representative information. Climate
Change 01 (20)
identifies a recent
increase in precipitation for the few, unrepresentative sites for which
it has data. Snow precipitation affects behaviour of glaciers (often
exclusively blamed on temperature), and the albedo (reflectivity)
of some regions. To
summarise: the role of water, as vapour, clouds, and precipitation, on
the climate which undoubtedly has the dominant role in the greenhouse
effect, is very little understood, and there are no reliable historical
records. Climate modellists are therefore reduced to guesswork, which
they call “feedbacks” Carbon DioxideTHE CARBON BUDGETClimate
Change 01 (21)
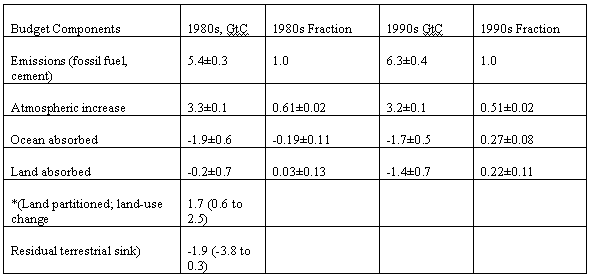
gives the following components of the Carbon
Budget, divided into decades Emissions
from the combustion of fossil fuel, gas flaring and cement are
considered to be partitioned between the atmosphere, the ocean, and the
land., according to the fractions shown. Table 3 Components of the Carbon Budget (21)
It will be seen that the fraction of the emissions from fossil fuels and cement entering the atmosphere has fallen from 0.61±0.02 to 0.51±0.02 between the 1980s and the 1990s. It is thought that the amount entering the ocean has fallen 1.9±0.6 to 1.7±0.5 GtC in the period. Partitioning of the carbon dioxide absorbed by the earth between the ocean and the land has used two methods (22). The first uses the change in atmospheric oxygen. Carbon dioxide absorbed on the land implies a simultaneous emission of oxygen, whereas absorption by the ocean does not. the second uses measurements of the relative abundance of the carbon isotopes 12C and 13C. C3 plants discriminate against 13 C and so change the ratio between the isotopes. Both these methods depend on an array of assumptions, and the accuracy is poor. It is, to begin with, difficult to believe that ocean absorption goes down with increased carbon dioxide concentration as suggested in Table 3. The calculated figure for carbon dioxide absorbed by land is also highly inaccurate. There is a tendency to try to partition the land absorption into two components, land-use change which is considered to cause an emission, and residual terrestrial sinks which causes an absorption. The emission part is sometimes added to the fossil fuel figure to give a gross emission. To be logical, if you are going to add emissions you should also subtract sinks to give gross emissions. In reality it is almost impossible to identify land surface regions which either emit or absorb carbon dioxide, although much effort has gone into trying. The large increase in land absorption from the 1980s to the 1990s must be due to greatly increased agriculture and forestry productivity. As there are only two points on a graph, it is difficult to say whether this trend will continue Emissions
Although
carbon dioxide is an entirely minor greenhouse gas, it has been
postulated that the emission of carbon dioxide by the combustion of
fossil fuels can have an important influence on the climate, and
therefore must be brought under control. The Nations
of the world have been involved for several years now in discussing
proposals for control of carbon dioxide emissions. It
is therefore something of a surprise to find that Climate
Change 01 has no
Chapter dealing with carbon dioxide emissions,
but only a very short paragraph in Chapter 2 (3.4.1.
Emissions from Fossil Fuel Burning and Cement Production)
and a single diagram (Figure 3.3)
showing emissions from 1958 to the year 1999.(23) Although
the developed nations involved in the .Kyoto Treaty process have methods
for measuring their own
emissions, the latest figure for world emissions from the Carbon Dioxide
Information and Analysis Center is for the year 1998. This means that
any measures to reduce emissions will require a wait of at least three
years before they will find whether they have had any effect on global
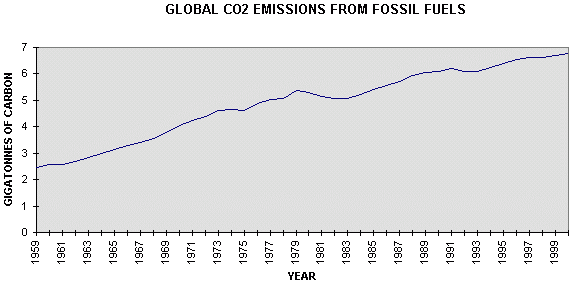
emissions.. .Figure 4.1 gives emissions from combustion of fossil fuels, gas flaring, and cement production, since 1950 (24), with estimates for 1999 and 2000 from BP (25)
Figure 4.1 Global
emissions of carbon dioxide from combustion of fossil fuels, It is evident that carbon emissions are somewhat irregular, but that there was a fairly linear rate of increase of 0.14 GtC/yr from 1959 to 1979 which was replaced by a fairly linear trend of 0.05 GtC/yr from 1979 to 2000, less than half the previous rate. The difference is attributed (Table 1) to a considerable increase in absorption by the land surface, a change which is largely unexplained. Atmospheric
Concentrations
Carbon
dioxide is one of the most difficult gases to measure It is only in the
last 20 years or so that an effective infra red analysis method has
evolved, free from the necessity of cross calibration. A
half-forgotten figure is G S Callendar.
He was an advocate of the existence of the greenhouse effect in
the late 30s and he backed up his claims with measurements of
the carbon dioxide content of the atmosphere which have been
discredited. He claimed
that the 19th century value of 274 parts per million
had increased to 325 parts per million by 1935 as a result of the
combustion of fossil fuels, and that this caused
an increase in global temperature of 0.33°C (26,27,
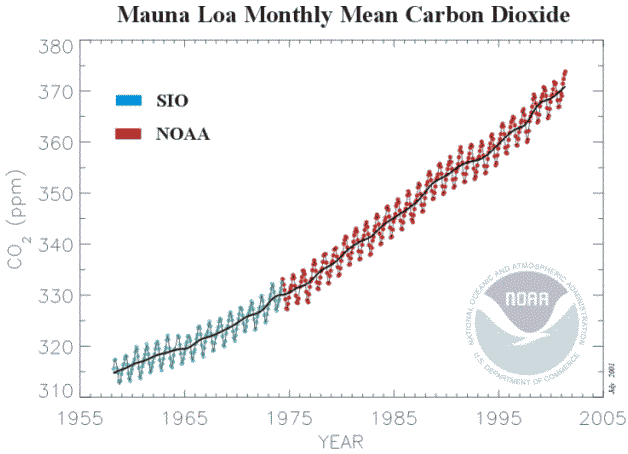
28), from Jaworowski (29). The whole subject was revived by the measurements of Keeling (30) from 1959, the latest version of which (31) is shown below (Figure 4.2). Before May 1974 the readings were at the Scripps Institute of Oceanography at La Jolla California
Figure 4.2
Monthly atmospheric carbon dioxide concentrations as measured
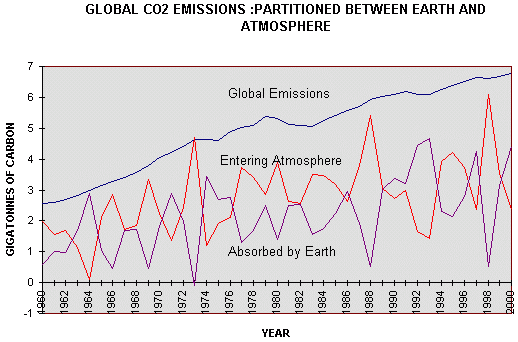
from 1959-1974, Subsequent measurements were near the summit of the Mauna Loa volcano on the island of Hawaii It is immediately apparent that the approximately linear rate of increase in California between 1959 and 1974 (0.9 ppm/yr) was followed by the approximately linear rate of increase from 1974 to 2000 at Mauna Loa (1.53ppm/yr) which shows no signs of changing. Since 1969 a world-wide network of stations measuring atmospheric concentrations of carbon dioxide has been established. In contrast to the weather stations measuring temperature, which are predominantly close to cities and buildings, the carbon dioxide network is deliberately located “remote from fossil fuel combustion and vigorous plant activity” (31). In other words, once more, they do not provide a fair average, and they do not provide information on the carbon dioxide concentration above most land surfaces, where most concerns are expressed about the consequences of the greenhouse effect. The claim that carbon dioxide is a “well-mixed” gas are patently untrue, as most stations avoid measurements when the wind is in the wrong direction ( from land) and record only concentrations from the sea. It is postulated that changes in atmospheric carbon dioxide concentration are caused by combustion of fossil fuels. If we assume, for the moment, that the Mauna Loa record can be considered to represent globally averaged carbon dioxide concentrations, then each annual increment in atmospheric addition should be the result of the annual emission of carbon dioxide. The calculation (Figure 3.3) shows, that generally the atmospheric increment is less than the emission. The difference must surely represent absorption by the earth.
Figure 4.3 Global
Emissions of carbon dioxide from combustion of fossil fuels and cement
between 1960 and 2000, compared with the annual increment into the
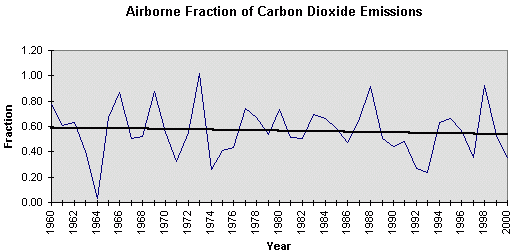
atmosphere, There does not seem to be a close relationship between the annual increment of carbon dioxide emitted by combustion of fossil fuel, cement production, and gas flaring, and the increment measured in the atmosphere. In 1966. 1969. 1973, 1988 and 1996 all, or almost all emissions entered the atmosphere. These were all El Niño years. In 1964, 1992 and 1993 none, or little, entered the atmosphere. 1964 was a La Niña year and so was 1993. So the fluctuations seem to be heavily dependent on the Southern Oscillation in the ocean. It is, however, obvious from Figure 4.2, that carbon entering the atmosphere has , on average, been constant at about 3 GtC/yr, since 1974, whereas the carbon absorbed by the earth has (when smoothed) increased from 1.5GtC/yr to 3.4GtC/yr over the same period because of increased plant production.(32) Figure 4.4 is a plot of the Airborne Fraction, that is to say, the fraction of emissions due to combustion of fossil fuels, cement manufacture and gas flaring, that arrives in the atmosphere. It will be seen that it has fallen from 0.59 to 0.52 between 1960 and 2000.
Figure 4.4 The Airborne Fraction of carbon dioxide emissions. Methane
Methane
is the third most important greenhouse gas,
after water vapour and carbon dioxide. There is considerable
disagreement on quantities emitted (33)
It is emitted partly from natural sources, 92-270 TgCH4/yr,
and partly from “anthropogenic” sources (which
include agriculture), 315-350
TgCH4/yr The
behaviour of methane in the atmosphere is completely different from that
of carbon dioxide, since it
decomposes rapidly, so that the atmospheric concentration depends on a
constant source of supply. The “lifetime” of methane in the
atmosphere is around 10 years (34) The
atmospheric concentration of methane has been measured at the same sites
that measure carbon dioxide since 1984, so it suffers from the same
defect of only measuring “background” figures. The true average, or
figures over land or industrial are unknown. The latest globally
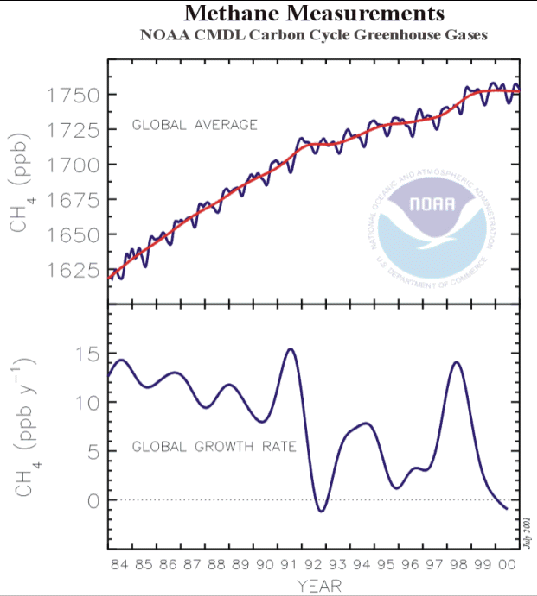
averaged figures are shown in Figure 4. 5. (35) It
will be seen that the rate of increase in the atmospheric concentration
of methane has been falling since 1984, and the concentration itself is
now falling. Methane therefore cannot be considered at present as an
important greenhouse gas, despite the emphasis placed on it by the IPCC
and by Kyoto negotiators. Other
Greenhouse Gases
Climate Change 01 (36)
lists 63 greenhouse gases additional to water vapour, carbon dioxide
and methane Many of these are halocarbons which are largely being
reduced because of their supposed effects on ozone in the stratosphere.
Since their calculated effects are marginal they will not be
further discussed here. Aerosols
Ordinary clouds are the most important aerosols influencing the climate, yet they do not feature in the Climate Change 01 Chapter 5 on “Aerosols: their Direct and Indirect Effects” (37). The uncertainties connected with their properties are concealed in their status as “feedbacks”. Chapter 5 does, however deal with influences on clouds which are dealt with separately from the influence of the clouds themselves.
Figure
4.5 Globally
averaged atmospheric concentration of methane since 1984 (35) The Chapter
lists eight kinds of aerosol, each of which has direct and indirect
effects. They are: Soil
dust, Sea Salt, Industrial dust, Carbonaceous
aerosols, Primary biogenic aerosols, Sulphate, Nitrates and Volcanoes. Most
of the effects of aerosols are difficult to measure, and the
uncertainties, all of which are unquantified
in a scientific sense, are very great. Many aerosols cool
the earth. Those predominantly due to industry should cool the Northern
Hemisphere more than the Southern Hemisphere, an effect not observed,
even by the most reliable temperature records. The effects of aerosols, and their uncertainties, are such as to nullify completely the reliability of any of the climate models, as will appear evident in the next Chapter. References1. Tyndall, J, 1859 Note on the transmission of heat through gaseous bodies. Proceedings of the Royal Society of London 10, 155-158 2. Baliunas, S, and W. Soon, 1999, Pioneers in the Greenhouse Effect. World Climate Report 4 (19). At http://www.greeningearthsociety.org/climate 3. Raval A, and V Ramanathan, Observational determination of the greenhouse effect 1989 Nature 342 758-61 4. Rind D, et al, 1991 “Positive water vapour feedback in climate models confirmed by satellite data” Nature 349 500-502 5.
Lindzen, R S 1994 “Climate Dynamics and Global Change”
Annual Review of Fluid
Mechanics 26
353-378 6.
Lindzen, R S 1993 “Absence of Scientific Basis”. National
Geographic Research and Exploration 9
191-200 7
Rind D 1998, “Just Add Water Vapour” Science
281 1152-1153 8
Climate Change 01 Chapter
7, “Physical Climate Processes and Feedbacks”
page 425 9
Inamdar, A K and V Ramanathan 1998 “Tropical and Global
Scale Interactions among Water Vapor, Atmospheric Greenhouse Effect and
Surface Temperature.” Journal
of Geophysical Research 103,
32177-32194 10 Climate
Change 01 Chapter 4 “Atmospheric
Chemistry and Greenhouse Gases”, pages 240-288 11 Climate Change 01 Chapter 4, page 241. 12 Climate
Change 01 Chapter 6 “Radiative
Forcing of Climate Change”, pages 349-416 13 Climate Change 01 Chapter 7 “Physical Climate Processes and Feedbacks”, page 427 14 Cess, R D et al 1990. “Intercomparison and Interpretation of Climate Feedback Processes in 19 Atmospheric General Circulation Models”, Journal of Geophysical Research 95 16601-16615 15 Cess, R D et al 1989 “Interpretation of Cloud-Climate Feedback as produced by 14 Atmospheric General Circulation Models” Science 245, 513-516 16 R D Cess 1996 “Cloud feedback in atmospheric general circulation models: an update”. Journal of Geophysical research 101 12791-12794. 17 Gates W L et al 1999 Bull Am Met Soc 80 29-55 18 Climate Change 01 Chapter 2 “Observed Climate Variability and Change”, Figure 2.3, page 109 19 W.B. Rossow ISCCP, 2001 http://iscpp.giss.nasa.gov 20 Climate
Change 01 Chapter 2. Page 159 21 Climate Change 01 Chapter 3, “The Carbon Cycle and Atmospheric Carbon Dioxide” page 190 22 Climate Change 01 Chapter 3, Figure 3, pages 205-207 23 Climate Change 01 Chapter 3, page 204 24 Carbon Dioxide Information and Advisory Center, http://cdiac.esd.ornl.gov/trends 25 British Petroleum. http://www.bp.com/centres/energy/world 26 Callendar, G S 1938 Quarterly J of the Meteorological Society 64, 223 27 Callendar G S 1940 Quarterly J of the Meteorological Society 65 395 28 Callendar, G S 1958 Tellus 10 243 29 Jaworowski 1997 Twenty first Century 10 (1) 42-52 30 Keeling C D et al 1989 in D H Peterson (Ed) Geophysical Monograph 55 American Geophysical Union, pages 305-363, updated by Reference 25 31 Carbon Cycle Group, NOAA, http://www.cmdl.noaa.gov/ccg 32 CO2 Science magazine, http://www.co2science.org/journal 33 Climate Change 01 Chapter 4, Table 4.2, page 250 34 Climate Change 01 Chapter 4 Table 4.3 Page 251 35 Dlugokencky E J , K A Masarie, P M Lang, and P P Tans, 1998, “Continuing decline in the growth rate of the atmospheric methane burden.” Nature, 393 447-450, plus update at NOAA Carbon Cycle Group 2001 http:///.cmdl.noaa.gov/ccg 36 Climate Change 01 Chapter 4 Table 4.1, pages 244-5 37 Climate Change 01 Chapter 5 “Aerosols, their Direct and Indirect Effects” pages 290-348 Go to Chapter 5 (to be published in a few days) Return to Contents and Summary
|
