Coping With Climate Change,
Based on Historical Experiences
by
Gary D. Sharp
Center for Climate/Ocean Resources Study
PO Box 2223, Monterey, CA 93942
![]()
Among the more important questions facing modern man are those issues of using the information that we have at hand to cope with change, particularly changes associated with the consequences of the manipulations, perturbations and obfuscations that humans have dealt over the recent century or two. This recent colonial period occurred as a result of an initial epoch of declining self-sufficiency as a result of the Post Medieval Warm period cooling, beginning in about 1180CE. Many local communities were decimated by disease and inability to sustain previous production due to the Earth's climate being somewhat drier, as a result of decreased atmospheric circulation, hence lower surface winds over the world's oceans. Many of those affected emigrated to spread out over the Earth. The Little Ice Age receded (~1830-1850), and the solar irradiance rose, once again, introducing one of the more beneficent climate periods in the recent several millenia.
Several of my colleagues and I have debated the dogma of Global warming vs Global Change, and concurred on the simple concept that the Earth's climate is forced from outside the atmosphere, by varying solar irradiance, and modulated by several internal dynamics. These internal dynamics involve the oceans, the atmosphere, and various sub-components such as clouds, ice and vegetation, all of which affect the Earth's albedo, and therefore the amount of the sun's irradiance that is either reflected, or incorporated into various time scales of internal dynamics, and eventually re-radiated as a means of maintaining thermodynamic balances. These processes vary on all time scales, and have local consequences, that include those observed in various locales, as entire ecosystems respond. I have spent several decades looking into long and short-term ocean ecosystem varuiabilities, along with many colleagues around the world. The lessons have been profound, and particularly relevant to understanding what humans must do to cope.
One fundamental hypothesis is that climate will continue to vary, in rythms that have their main sources in external System Physical Interactions, and that these will continue as they have in the past. That is not to say that they cannot be affected by human interventions, but only that we have no control over these External System Forces.
Given this basis, we have gathered distinct information resources together, and contributed them to a common pool. We are working toward better forecasts of Earth's future climate, by extending what has been observed, on many time and space scales.
Human populations have always seemed to take advantage of "warm" periods, increasing in numbers and creating more and larger local colonies, or cities. Having attained six billion in recent years, the questions are how long can this growth continue, and what will happen when Earth's climate once again changes back toward a cooler, drier epoch? The following graphic shows a few basic observations that bring some of our thinking together. First we must deal with the simple fact that the earth is a "Warm" "Wet" planet, that undergoes periodic "Cooling", otherwise, life as we know it would not have evolved.
 Climate
Changes, people and fishes respond. This is patterned, although not symmetric.
This sets the stage for other questions. Since Sol, our sun, is the only
source of energy for the life processes that have evolved, What causes
the "Cooling Events"?
One of the most illuminating discourses on the Earth's climatic forcing, within the context of its atmospheric dynamics can be found in Marcel Leroux's Dynamic Analysis of Climate and Weather (1998, Wiley-Praxis) in which he points out that the rates of evolution of Mobile Polar Highs, or polar subsidence events, affect the climate and weather, from local to global scales. In fact, if you think about it, given the recorded information from paleo-science studies, the equatorial ocean has remained within a very small range of temperature values, despite the huge responses of the polar oceans, ice caps, and high altitude glaciers. This suggests that the rates of heat loss at the poles is the main modulator of global climate. Leroux's arguments are profound, and his direct evidence derives from the global observational data base from satellites.
On the other hand, we have a planet, Earth, that is 70% ocean, with it's various climatic and weather contributions involving the hydrologic cycle, as well as sequestered heat that circulates within the oceans, in response to thermosaline dynamics on many time scales, from daily, seasonal, to decades, centuries, and millennial.
The unique picture is that at the equator, these dynamics vary seasonally as a complex interaction between both ocean and terrestrial processes, creating major regional disparities, as the southern hemisphere contains mostly ocean, and the northern hemisphere is dominated by terrain. One exciting observation that satellites have provided is the remarkable dynamics of the Inter-Tropical Convergence Zone, or atmospheric equator, seasonally, and from year to year. The huge cloud towers, the result of "Deep Convection", i.e., the intense expulsions of upper ocean heat wherever the sea surface temperatures exceed about 27.5C, can reach over 60,000 feet into the sky, and are unmistakably the most important source of water (energy) in the Earth's vast rushes toward thermodynamic equilibrium. The real point here is that the "equilibrium" can never occur, simply due to the differences in rates of motion in the oceans and atmopshere, and the various dynamics of heat losses at the poles.
The solar irradiance variability has been measured only with any accuracy since 1979, from extra-atmospheric remote sensors. Previosly, the sun's surface dynamics have been tracked by astronomers, since the telescope was first deployed by Galileo Galilei, and various features have been observed with exquisite precision, without any means for defining either what they represented, nor their real consequences in terrestrial terms, until the mid 20th Century. Similarly, the ocean's dynamics have been appreciated since humans first set sail, but only recorded in any systematic manner since Fontaine Maury initiated the ocean observations of trading ships in 1854.
So, where have we been, and how do we begin to understand where we might be headed? Certainly not from only the technologically superior, but short-term observations of the modern Earth Observing System. We need to look carefully into the past, and collect together all the historical perspective that is possible. Otherwise we will continue to be surprised, and likely suffer ever more dire consequences, as humanity continues to grow, and continues to reduce or remove ecological options, and in specific terms of being able to procure adequate food and energy resources to sustain itself through pending changes.
Dr. Joseph Fletcher has passed more than fifty years helping to create and implement environmental observing systems, for an array of practical applications. He also inspired the collation of the ocean observations since Maury's program began, into a Consolidated Ocean and Atmosphere Data Set (COADS), that has become the mainstay of all Global Climate Research. Beyond these efforts, he has always been an innovator in the analysis and interpretation of climate time series. Among his recent efforts the creation of a new index, the Warm Pool Index, provides major insights into Global climate dynamics, as well as regional prognostics. For example, the following graphic depicts the changes in the numbers of 4x4 degree squares in the Equatorial Warm Pool region of the Indo-Pacific Ocean over the recent 110 years.
 The decadal
scale trends catch the eye, as well as do the spectacular changes since
the early part of the 20th Century. The major peaks along the entire record
indicate the ENSO Warm Events, or El Niños, while just folowing
these, you can observe major cooling events, or the La Niñas. These
latter offer great opportunity to forecast major perubations, such as the
recent droughts and the spate of wildfires across the world (not just the
USA). North Africa, western India and Pakistan, as well as a vast area
north of the Arabian penninsula and Gulf are suffering drought and famine.
This is neither the first time, nor, obviously, the last time that a La
Niña Cold Event will have these results.
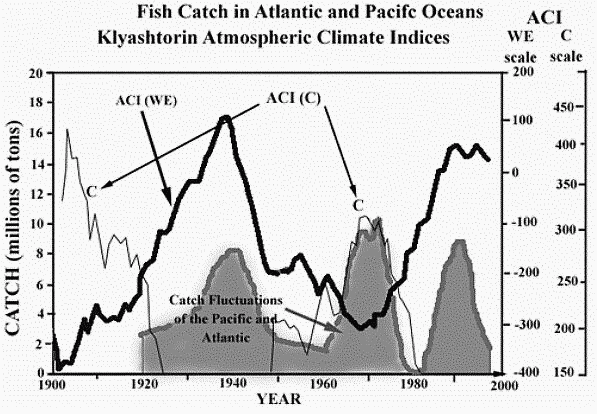
Meanwhile, my own concerns are with large marine ecosystems, from which major portions of the world's population obtain the majority of their protein resources. My colleagues in fisheries science have been squabbling amongst themselves, and other vested ineterests about where to focus in fisheries management, and I and a few enlightened colleagues have been trying to tell them that it is necessary to stand back, and take the broader view, as catch and landing statistics do not tell the stories of fisheries comings and goings in sufficient detail to allow anyone to manage for sustainability, whatever that means. The problem is simply that aquatic ecosystems respond directly to climate forcing, again on all time and space scales, and therefore fisheries must be managed as a "System", not as individual unrelated components. The fundamental description that has emerged is in the following graphic, from Leonid Klyashtorin (VNIROV, Moscow), That shows the two patterns of variation in catches from two classes of ocean fish populations, one group from a Warm environment, the other from Cold, often upwelling environments.

The unique picture is that these vary in synchrony, within two climatically distinct epochs, with overlap as they transition one from the other, within a 70-80 year cycle. This same pattern of variation occurred in a 2000 year paleosediment record of fish scales collected in an anoxic basin off Southern California, suggesting its generality.

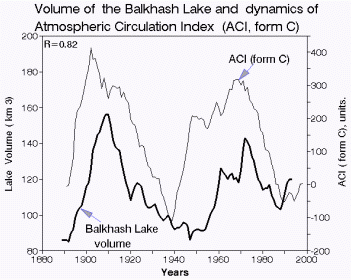
Klyashtorin, rediscovered and applied geophysical atmospheric climate indices (ACI) from a deceased countryman. (A.A.Girs) who found that a general pattern of changes in dominant wind direction (West to East =WE, or North to South=C) patterns coincide with climate states over three large ocean basins. Klyashtorin discovered the ACI were coherent with the rises and falls of the major fishery resources. Similarly, Klyashtorin discovered that Lake Balkhash, with no outlet and fed by a wide watershed that integrates the region just east of the Aral Sea, appears to rise and fall on the same schedule.

