The IPCC Carbon Dioxide
Predictions
are Erroneous
by
Jarl R. Ahlbeck D.Sc.(Chem Eng.)
Research Associate, Abo Akademi University, Finland
e-mail: jarl.ahlbeck@abo.fi
![]()
Introduction: The global warming chain of hypothesis
The global warming theory can be split into the following chain of hypotheses:
H1: The anthropogenic emissions of greenhouse gases, especially carbon dioxide, will increase to a great extent in the future if no global limitation agreements are realized.
H2: As a result of H1, the atmospheric concentration of carbon dioxide will increase rapidly as about half of the emitted carbon will stay in the atmosphere.
H3: The direct radiative influence of increased atmospheric carbon dioxide concentration is minute, but water vapour and clouds will gain the influence by positive feedback mechanisms, thus causing significant global warming.
H4: The global warming is so large that it becomes detrimental for the nature and for human beings.
If all the hypotheses, H1+H2+H3+H4 are true, there is ground for concern. If one of the hypotheses is rejected, there are no environmental reasons for carbon dioxide emission limitations.
H1: Exaggeration from the very beginning
The anthropopogenic emissions of carbon dioxide will certainly increase during the following years, but due to the limited reserves of fossil fuel, no rapid increase in the long run is possible. The often cited IPCC scenario IS92a seems unrealistic because all known and hypothetical reserves of about 1500 GtC fossil fuel wold have been used during the next century.
 H2:
IPCC predictions
In the IPCC "bible" Climate Change 1995, The Science of Climate Change, Cambridge University Press, 1996 shows on page 23., Figure 5a and 5b, future anthropogenic carbon dioxide emissions according to some different scenarios and corresponding values of the future atmospheric carbon dioxide concentration, see Figure 1. For the emission scenario IS92a, IPCC estimates that the atmosphere will contain more than 700 ppm(v) carbon dioxide in the the year 2100.
These concentration values are claimed to be calculated by a global carbon dioxide model, the "Bern model" according to Siegenthaler, Joos and Wigley.
Computer simulation or a wild guess ?
When the diagrams are analyzed, however, it is easy to discover that the plotted carbon dioxide concentration curve can be calculated directly from the given emission curve by a trivial mass balance using a constant value of 50% for the airborne fraction, see Figure 1. (The massbalance equation is given in my report "Statistical Analysis of Atmospheric Concentration of Carbon Dioxide" on this site). For emissions according to IS92a the results of the mass balance are marked with dots. The IPCC predictions do not seem to be the result of any computer simulation, they seem to be calculated from the emission scenario directly by a simple mass balance using the wild guess of a constant airborne fraction of 50% for the next hundred years.
It is of course possible, that calculations with the "Bern model" results in an airborne fraction that is very close to constant, 50%, although the other published scientific works of the modellers indicate a value of the airborne fraction that changes with time.
Linear increase of anthropogenic emissions 1970-1997.
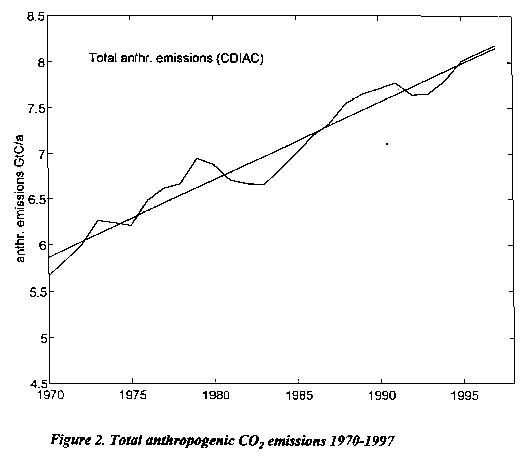 |
We now look at Figure 2. that shows the total anthropogenic emissions for the period 1970-1997 (CDIAC - data). The emissions has been a linear function of time with some jumps due to the "energy crisis" and the collapse of the Soviet Union. A constant deforestation term, 1.6 GtC/a is involved. |
IPCC model vs. measured concentrations at Mauna Loa
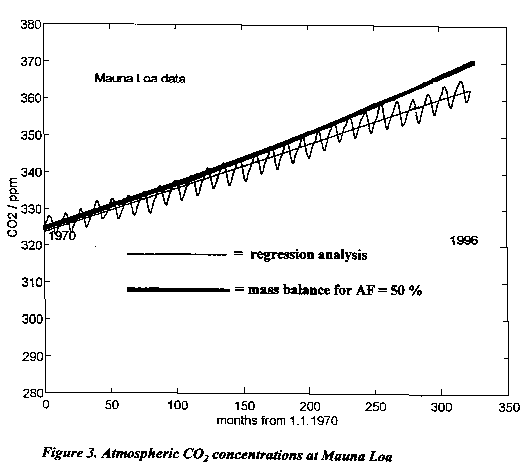 |
We now use the emissions according to Figure 2. in the trivial mass balance together with AF = 50% that gave the IPCC carbon dioxide estimates for the next century. We obtain the thick curve in Figure 3. where the curve is plotted in the same diagram as the measured concentration at Mauna Loa. The measurements at Mauna Loa are generally assumed to be representativ for the whole globe. The thick carbon dioxide curve is a parabola segment. The statistical analysis of the real Mauna Loa data, however, gives a linear relationship (thin curve) that is quite different from the result of the AF = 50 % mass balance. |
IPCC model vs. measured concentrations at Mt. Cimone
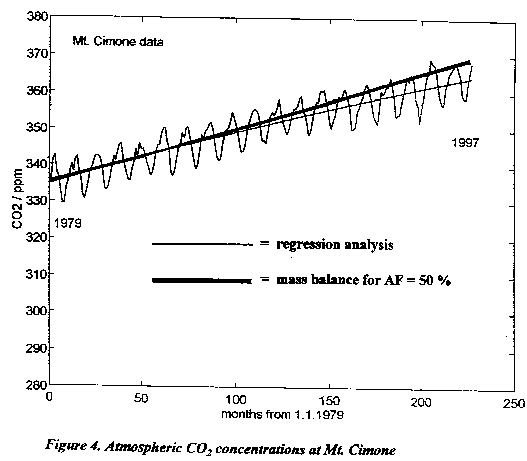 |
The same operation can be performed for the period 1979 - 1997 for
data from Mt. Cimone in Italy, see Figure 4.
The AF=50 % mass balance gives carbon dioxide concentrations (thick curve) that increase faster than the measured concentration values. The regression analysis for Mt. Cimone gives a parabola segment with a statistically significant second order coefficient (thin curve), but the statistical second order coefficient has got an opposite sign, it is negative when the IPCC model would imply a positive sign. |
The rate of increase in carbon dioxide concentration at Mt. Cimone has thus been decreasing during the period.
The airborne fraction is decreasing.
In fact, the mean value of AF has been a little lower than 50 %, it has been about 46 % during the period 1970-1997, see Figure 5.
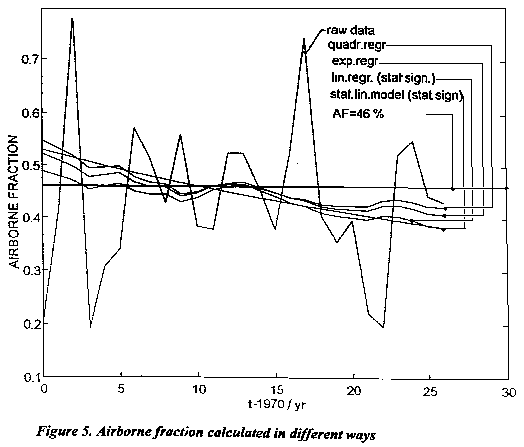 |
But the value has not been constant, it has been decreasing. The decreasing value of AF can be calculated in different ways dependent on what type of curve fit is used for the Mauna Loa data. The only statistically significant fit is the linear one. The airborne fraction has decreased probably due to the response of the oceans and the biosphere to increased partial pressure of carbon dioxide. It is highly probable that this trend will continue in the future. |
Predictions based on a statistical mass transfer model
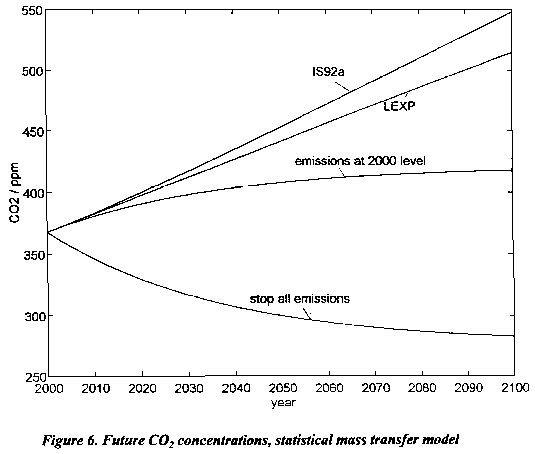 |
Finally Figure 6 gives my own predictions of the future concentration of carbon dioxide. They are calculated by the statistical mass transfer model I presented in my report "Statistical Analysis of Atmospheric Concentration of Carbon Dioxide" on this site. Every prediction of what is going to happen in the future is very uncertain, but it seems obvious that the IPCC model overpredicts the carbon dioxide concentration for the year 2100 with the scenario IS92a by at least 100 ppm. |
Conclusions
The calculations above clearly show that the hypothesis H2 should be rejected due to lack of experimental confirmation. The atmospheric concentration of carbon dioxide will continue to increase due to anthropogenic emissions, but the rate of increase will be moderate. The IPCC carbon dioxide predictions are cited in mass media all over the world as the scientific truth although they tell a different story than the real measurements do. The zero increase of carbon dioxide in 1992 after the Mt. Piatubo eruption is offered as an explanation for the failure of the IPCC model. This event is said to be occasional and the increase of the carbon dioxide concentration is assumed to accelerate in the future. But Figure 3. shows clearly that the carbon dioxide concentrations at Mauna Loa start to divergate from the mass balance curve for AF = 50 % as early as in the year 1975 (60 months). The Mt. Cimone diagram, Figure 4. shows that the increase of carbon dioxide concentration during 1997 vas very small.
![]()
Return to Climate Change Guest Papers
Return to "Still Waiting For Greenhouse" main page