Skating on Thin Ice
by
John L. Daly
(23 Jan 2000)
A criticial comment on -
Rothrock, D. & Maykut, G., (1999), "Thinning
of the Arctic Sea-Ice Cover",
Geophysical Research Letters, v.26, no.23, pp.3469-3472, Dec 1 1999
![]()
Skating on Thin Ice
by
John L. Daly
(23 Jan 2000)
A criticial comment on -
Rothrock, D. & Maykut, G., (1999), "Thinning
of the Arctic Sea-Ice Cover",
Geophysical Research Letters, v.26, no.23, pp.3469-3472, Dec 1 1999
![]()
![]() Introduction
Introduction
In common with many papers on the subject of climate change, the media releases often tell a very different story to the scientific papers they report on. In some cases, the authors of the papers fail to correct the misinterpretations made of their papers in these releases. The above paper on the alleged thinning of the Arctic sea ice was one such example. The release of the paper was accompanied by a blaze of publicity, as it reinforced the current hype about greenhouse warming. But did the paper itself really discover a thinning of Arctic sea ice caused by the alleged human-induced `global warming'?
![]() How
the Ice Thickness Was Measured
How
the Ice Thickness Was Measured
Specifically, the study measured `draft' as opposed to actual ice thickness. This is the depth of ice below sea level, and thus excludes any ice thickness above sea level. The ice draft was measured from submarines using sonar equipment, thus allowing fairly rapid transits of sections of the Arctic Ocean, averaging the draft data measured. Arctic ice varies in depth from 1 metre to 5 metres, so that the underside of the ice will have an undulating contour.
The ice draft was measured during two distinct periods. The first phase occurred between 1958 and 1976, where several submarine cruises were made. These were -
| USS Nautilus USS Seadragon USS Seadragon, USS Skate USS Queenfish HMS Sovereign |
1958 (August) 1960 (August) 1962 (July) 1970 (August) 1976 (October) |
The second phase, and the one upon which this study was based was conducted between 1993 and 1997 using US submarines USS Pargo (1993), USS Pogy (1996), and USS Archerfish (1997), all of them making sweeps of the Arctic ice during the month of September.
After averaging of the ice draft data between the two periods, the authors concluded that -
"In summary, ice draft in the 1990s is over a meter thinner than two to four decades earlier. The mean draft has decreased from over 3 metres to under 2 metres".
It is little wonder the greenhouse industry seized upon such a dramatic conclusion and made a media circus out of it. But were these conclusions sound? Did the ice thinning, if indeed it was such, represent global warming in action, or were other factors in play?
![]() Data
Corrections
Data
Corrections
The ice thickness data was not simply a case of taking a set of numbers and averaging them. The authors subjected them to extensive corrections. The first correction was to normalize all the data to September. Ice thickness varies with the seasons and the first phase measurements were taken in different months, which meant like was not being compared with like.
So the authors used a model.
While the public may have gained the impression that the evidence here was strictly observational (and thus more acceptable than mere computer models), we already have the intrusion of a model to `correct' the ice draft data from the first phase. Are the data corrections `correct'? They are only as good as the assumptions inherent in the model.
There was also a second set of corrections made, this time on the data from the USS Nautilus (1958) and the HMS Sovereign (1976), the two `outlier' data sources. This was prompted by the fact that the sonar equipment used in the other submarines in the first phase and all those in the second phase were all `narrowbeam' sonars. But the Nautilus and the Sovereign used `widebeam' sonars. To compensate for this, the authors made additional corrections to the data from these two submarines by multiplying everything by 0.84. But was this an adequate correction for such a significant equipment difference?
With narrowbeam sonar, the beam is able to readily pick out ridges and troughs in the underside of the ice, so that if the ice has an undulating subsurface varying between, say, 2 metres and 4 metres, the sonar will `see' these undulations and the computer can make a reasonable average to, say, 3 metres.
Not so with `widebeam' sonar. With a wide beam, the sonar cannot discriminate between the peaks and troughs in the ice, and instead returns an echo which only records the thickness at the peaks, so that any statistical averaging will come up with 4 metres (ie. the ice thickness at the peaks) but not recording the troughs or crevices in the way a narrow beam would do. In the example just given, a correction of 0.75 would be needed, not 0.84. If the beamwidth correction is inadequate, the Nautilus and Sovereign data will give the impression of observing thicker ice than in fact existed at the time. This would then compare unfavourably with the ice more accurately measured by narrow beam sonars in the 1990s.
![]() The
1960s versus the 1990s
The
1960s versus the 1990s
Even without the double corrections applied to the Nautilus and the Sovereign and their widebeam sonars, the remaining submarines in the first phase recorded narrowbeam sonar readings of the ice draft between 1960 and 1970. How might a measured thinning of ice between the 1960s and the 1990s be explained? Is it evidence of human-induced `global warming'?
 |
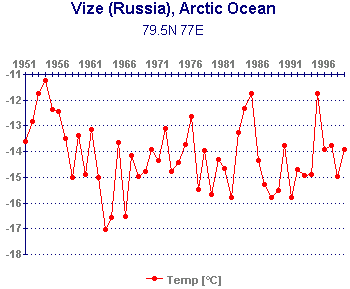
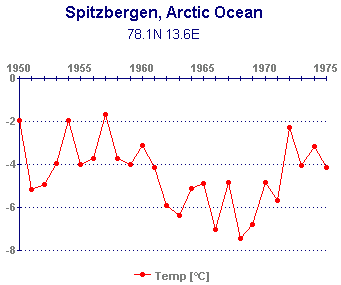
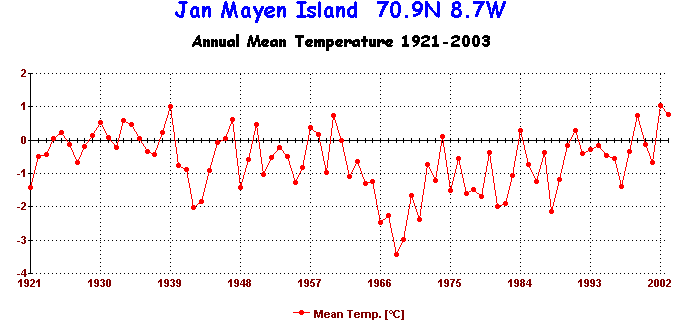
The three graphs shown here are the temperature histories
of weather stations located within the Arctic region. The graphs are derived
from uncorrected data obtained from the NASA
Goddard Institute.
One feature common to all three (and also to other stations in the region) is that the 1960s are an anomalously cold period in the Arctic, the very period when the `narrow beam' sonar submarines were making their cruises. Since ice thickness varies with temperature, (as acknowledged by the authors when they drew attention to the need for seasonal adjustment), it follows that the Arctic ice would naturally be thicker during an anomalously cold period like the 1960s. |
 |
In other words, far from the 1960s being the standard
for `normal' ice thickness, it is the 1960s which is abnormal, and the
present which is normal.
Had we been able to examine submarine data from a period earlier in the 1950s, 1940s, and especially the excceptional warmth of the 1930s, we may well have seen Arctic ice at that time exhibiting much the same draft as modern ice. This is yet another classic case of the start and end dates of data comparisons being decisive in influencing the final conclusions, and indeed leading to false conclusions. |
| The chart of Spitzbergen ends in 1975, as this is when the
available data ends. However, it does show the cold period of the 1960s.
The chart of Jan Mayen (below) is particularly useful as it has a long consistent
record from 1921 to 1999. We can readily see from this that the peak warmth
occurred in 1939, with the 1930s generally being warmer than the 1990s.
Not only does this contradict the greenhouse industry's claims that the
1990s were the warmest decade, it also contradicts the basic theory that
`global warming' will happen mostly in high latitudes such as the polar
and sub-polar regions.
We can infer from this meteorological evidence that sea ice draft would have been even thinner in the 1930s than it is today. |

As scientists in this field, the authors should have been aware of the exceptional cold of the 1960s period. If so, their results should have been no surprise to them or their reviewers. However, this particular detail was neither mentioned nor implied in their paper, leaving the media and the public with the impression that the thinning of ice had resulted from man-made factors instead of being simply a restoration of the ice to its normal pre-1960s thickness.
|
Update: (2nd March 1999) At the time of writing, the exceptional cold of the Arctic during the 1960s was assumed to be largely due to natural variability. A new paper on this website demonstrates this was not the case. Massive nuclear testing, particularly by the old USSR at their test site at Novaya Zemlya (a large island within the Arctic Ocean) during the 1950s and 1960s suggests the exceptional cold of those years was not natural at all, but artifical, caused by dust and aerosols blasted by these tests into the Arctic stratosphere. It is little wonder therefore that these two decades show up in the Arctic station records as the coldest of all. To see the cooling effect, see the above temperature graphs. This puts the comparative ice mass data between these years and the present in an entirely new light. The submarine study is effectively making an adverse comparison between present conditions and those which existed during an artificially cold period in the Arctic, a mini nuclear winter. It is now neither possible nor credible to treat the 1950s/1960s in the Arctic as a baseline condition against which the present should be compared. Indeed, since the post-war cooling was also global in extent, all temperature and proxy studies which use these years as a baseline condition are effectively null and void as far as their scientific credibility is concerned. This latest paper on this website which gives a detailed account of nuclear testing during these years can be viewed here - "The Big Bangs !", by Ken Parish of Darwin, Northern Territory, Australia. |
![]() Conclusion
Conclusion
Contrary to what the public circus over this study says, this is yet another example of a `proxy' study (ie, a study where `warming' is measured by proxy indicators other than direct measurement such as with a thermometer), which uses models, `adjusted' observational data, esoteric statistics, and false interpretation of data from atypical start and end dates. The conclusion by the authors that the ice had indeed thinned over the period in question was sound enough, although the extent of the thinning may have been overestimated by the seasonal and instrument adjustments applied. What was grossly unsound was to interpret this as an abnormal event, to treat the anomalously cold period of the 1960s as being the `normal' baseline condition, and to thus compare the present unfavourably with it.
The only really useful indicator of Arctic ice is that of extent (ie. the total area of ice cover), as this can be determined easily by satellite survey. During the current northern winter (1999-2000), sea ice extent has been even greater than in previous years, particularly around Alaska.
What might have been useful science in this paper ended up as being just another example of greenhouse `spin', serving only to prop up an ailing theory and the multi-billion dollar industry it supports.
![]()
Return to "Still Waiting For Greenhouse" main page