A Smoking Pea-Shooter by John L. Daly 19 March 2001 "
'Data conclusively show human role in greenhouse effect' researchers
say" - (Globe & Mail) These were the headlines which were flashed around the world in the second week of March, resulting in a media frenzy over yet another `new' global warming story. What triggered it was a small paper in Nature (v.410, p.355, 15 March 2001) by a team led by British physicist John E. Harries, which claimed to have discovered the imprint of human activity on the Greenhouse Effect, based on comparative studies between satellite-observed Earth's infra-red radiation profiles measured in 1970 and then later in 1997.
The Media Spin Here are a sample of quotes from the various media stories, which show something of the alarmist spin which the various media outlets put on this story -
There was clearly a misunderstanding here. Gases are not `leading to' the greenhouse effect. It is there all the time - we would not be alive without it. Confusing the natural greenhouse effect with changes to that effect are two quite different things.
Globe & Mail were not quoting accurately. What the researchers actually wrote in their paper was -
Note the careful wording of the original text. The results were not consistent with `the heating up' of climate as the media spin put it, nor were they consistent with `radiative forcing' of climate. Rather they were consistent with concerns over the radiative forcing of climate - an evasive a form of words allowing the researchers an element of deniability - a common practice in greenhouse science papers.
In a multi-billion dollar industry, nothing happens by chance. We are asked to believe that all these weekly scare stories we have been subjected to over the last year were the result of chance research, that just `happened' to come to light.
The Harries paper made no such claim. It stated there was a `significant increase in the earth's greenhouse effect' - not the same thing. Incredibly the very same ENN report contradicted itself when it later stated -
Reuters, with their usual attention to detail stated in their report -
Only in the Reuter's report do we get the slightest inkling that the much trumpeted `significant increase in the Earth's greenhouse effect' was found to be mostly in the non-CO2 gases - methane and CFCs. In 1970, methane was growing rapidly in the atmosphere, but has since levelled out, so there has been very little increase at all in the last 8 years. In other words, methane is no longer a problem. In 1970, CFCs were also growing in the atmosphere, being a greenhouse gas in its own right. However, CFCs have been banned over the last 12 years by the Montreal Protocol due to their alleged detrimental effect on the ozone layer. CFCs too have ceased to grow in the atmosphere and are expected to decline steadily over the coming decades.
The Actual Findings When reading the whole paper, one is struck by the lack of substantial change in the infra-red spectrum of the earth over the 27-year period cited. Here is a colourised enlargement of the primary graph they present to demonstrate their case. Specific wavelength bands associated with particular gases are added. |
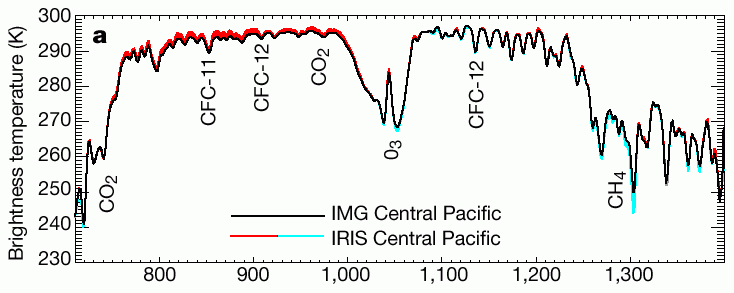
Fig.1 - Earth's Infra-red radiation to space from the IMG and IRIS
instruments
This graph shows a comparison between
the infra-red radiation spectrum as measured in 1970 by the `IRIS'
instrument on the Nimbus 4 spacecraft, and the 1997 spectrum measured by
the `IMG' instrument on the Japanese ADEOS satellite. The geographical
area represented is the Pacific Ocean from latitudes 10°N to 10°S and
longitudes 130°W to 180°W. The 1997 IMG plot is the thick black
line. The red infill shows where the 1970 IRIS plot was higher than the
IMG plot, while the light blue infill shows where the IRIS plot was
lower than the IMG plot.
As we can see, the differences are only slight, though detectable (thus making them `statistically significant' - a far cry from being climatically significant). Most of the earth's radiation escapes to space via the two main radiation windows - wave numbers 750 to 1,000, and numbers 1,700 to 1,250. The changes due to CO2 are so slight as to be within the margin of instrument error. Only the methane (CH4) band shows any significant change, a fact highlighted by the authors who described it as a `strong negative Q-branch' at wave number 1,300. The CO2 features (light blue) in the 700 to 1,000 wave range were described as `weak'. They appear that way in the chart too. So, the `significant increase in the greenhouse effect' reported by the authors is primarily caused by methane, not CO2. That crucial fact has been lost in the media circus, particularly given that methane has ceased to grow in the atmosphere and is thus no longer an urgent issue in the climate debate. But even here, the paper's authors may have got it wrong. Here is an infra-red radiation plot from a 1970 satellite located over Guam in the western Pacific. |
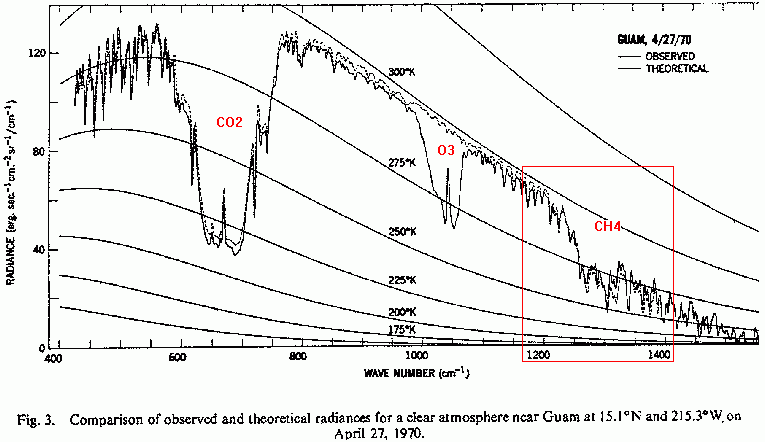
Fig.2 - Infra-red radiation from Earth near Guam in 1970
Fig.2 shows a `black body' curve for
earth radiation to space measured from a satellite, in contrast with the
`straight line' presentation given by the paper's authors. Note
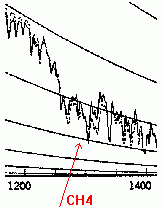
particularly the red square marked `CH4', being the region of the
radiation spectrum where methane is active.
If we compare the deep spike at wave 1300 in Fig.2 with the same spike at wave 1300 in Fig.1, we find that the 1997 IMG value for that spike is practically the same as for the same spike in 1970 as measured over Guam. The 1970 IRIS value for that spike in Fig.1, coloured in light blue, is inconsistent with that same spike for 1970 as shown in the Guam plot in Fig.2. This mismatch between the 1970 IRIS depiction of that spike and the 1970 Guam depiction of it raises the distinct likelihood that the paper's conclusions about methane are faulty due to instrument errors unknown to the authors, or underestimated by them. Without that methane spike, there is no `significant increase in the greenhouse effect'. The CO2 changes indicated in Fig.1 are too weak to be significant, and given that the stronger methane indication is likely to be in error, the much weaker indications from CO2 must be even more suspect.
The IRIS and IMG instruments If we are to conclude that instrument or processing errors exist here, the question then arises as to what differences may exist between the 1970 IRIS instrument and the 1997 IMG instrument. Better technology springs to mind obviously, but aside from that the Harries paper does present the instrument specifications. The `spectral range' is
given as 600-3,000 for IMG, and 400-1,600 for IRIS Clearly, these instruments were very different both in performance, and obviously in the quality of technology employed. To overcome this problem, the authors were obliged to reduce the resolution of the IMG data to make them more consistent with the IRIS data. They were confident their corrections would eliminate most errors. However, the apparent error in their `strong' methane Q-branch at wave 1,300 must cast doubt on the accuracy of their procedure or the quality of the data they were handling.
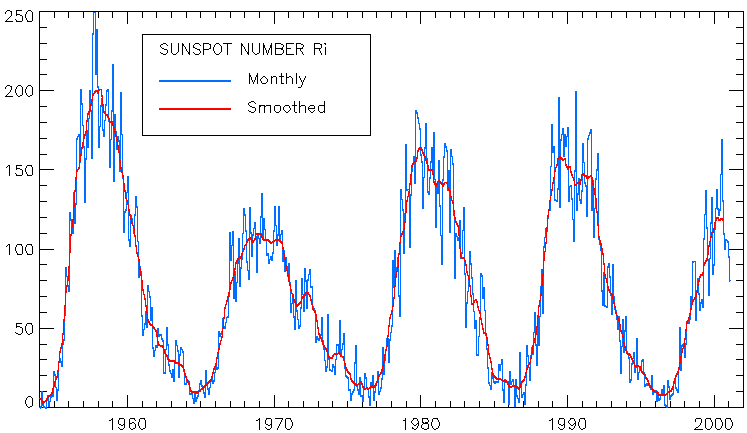
Wild Cards Making any comparison between 1970 and 1997 raises the problem of different climatic and atmospheric states between the two years which may affect the infra-red radiation profile from the Earth. The big 1997-98 El Niņo began during the period of the IMG data, resulting in a massive re-distribution of atmospheric and ocean masses in the very same part of the world as the satellite study. It would be quite likely to affect the profile, certainly to make it a little different to what it was in 1970 when the dominant Southern Oscillation mode was that of a weak La Niņa. And what of the solar cycle, which we now know causes climatic effects, and redistributes solar radiation toward the ultra-violet during solar maxima? Here is a chart of the last three solar cycles (20, 21, and 22) |
Fig.4 - The solar cycle (sunspot counts) from 1965 to 1998 (from http://sidc.oma.be)
As we can see, 1970 was dominated by a solar maximum (cycle 20), while 1997 was during a solar minimum after the cycle 22 maximum. This would affect not only the total radiation from the sun, but also the spectral distribution of that radiation, again making 1970 different to 1997.
Conclusion From the foregoing, we can safely disregard the media hysteria about this paper's findings. At face value it proves little that we did not already know. The `increase' in the greenhouse effect claimed was mostly caused by a real or imagined change in the methane spike at wave 1300, not by CO2. The instruments themselves are so different as to make some variation between the two data streams inevitable. It should be no surprise therefore that some slight differences are present. The climatic states of the two years in question were very different. 1970 was during a solar maximum with a weak La Niņa in progress, while 1997 was a solar minimum year with a powerful El Niņo starting. Both these features would cause differences to occur in infra-red profiles from the very part of the world most affected by the sun and El Niņo/La Niņa - the tropics in the western Pacific. And even if we accept the `statistical significance' of the two gases identified as showing the greatest effect, namely methane and the CFCs, neither gas can be considered as problems at the present time. Methane has now stopped increasing, while CFCs are already in decline due to the restrictions of the Montreal Protocol. The primary gas at the centre of the greenhouse controversy - CO2 - gives only weak indications in this study, well within the range of instrument error between two very different instruments separated by technologies 27 years apart. This study is in no way a `smoking gun' as hoped for by the industry. It's more a smoking pea-shooter. |
Return to `Cuttings from the Greenhouse' page
Return to `Still Waiting For Greenhouse' main page