|
The Nenana
Ice Classic: A Critique of - "Climate Change in Non-traditional Data Sets", by John L. Daly (Comments on this report shown at the end)
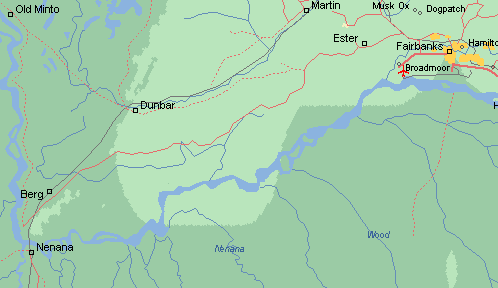
The above short paper appeared in Science, the title itself suggesting the author's intent, that of demonstrating `climate change' (code for global warming) in the data of the Nenana Ice Classic. The `Nenana Ice Classic' (which was featured on this site early this year [2] ) is a betting lottery which began at Nenana, Alaska, back in 1917 and has been run annually ever since. In January each year the townspeople mount a tripod out on the frozen Tanana River which runs through the town. The tripod is secured firmly to the ice and a rope run from the tripod to a clock mechanism at the shore. When the ice breaks up in late April or early May, the tripod gives way, gets carried only a short distance, finally tripping the clock. The time is then recorded.
The lottery organisers take bets from people all over the world, the winner being the person who can make the closest prediction of the actual date and time of breakup. Because there is big money involved, there is strict adherence to rules. This year (2001), the winner was a Japanese resident.
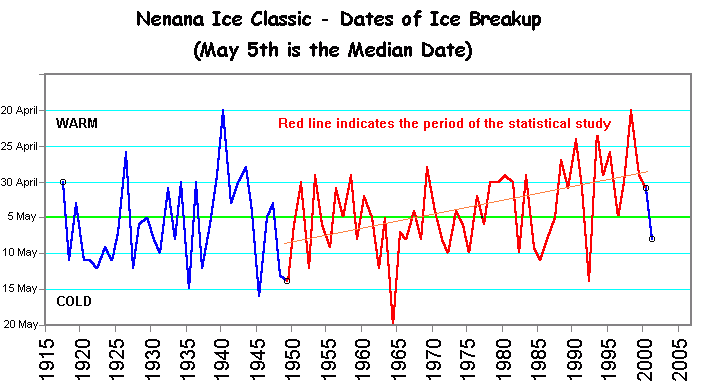
The Segarin & Micheli paper suggested two mechanisms which would determine the timing of the ice breakup, namely `thermal effects' (in other words, the ice melting beneath the tripod), and `dynamic effects' (the ice being undercut and broken by mechanical forces from upstream). While both these mechanisms would be climatic in origin (temperature in the case of melting, precipitation in the case of dynamic breakup), the authors did not explore the possibility that the city of Fairbanks upstream of the tripod might be artificially warming the river as a result of runoff and water usage in the city, all of which would end up in the Tanana River. The effect of an urban warming of the river would be subtle, but could make a significant thermal difference over time as Fairbanks expanded in population. The record of ice breakup is shown below. The record for earliest breakup (suggesting climate warmth) was on 20th April 1940 at 3.27 p.m. In 1998, that record was almost matched, but fell short by just 1½ hours, 20th April 1998 at 4.54 p.m. The latest breakup occurred on 20th May 1964 at 11.41 p.m. during a cold period globally.
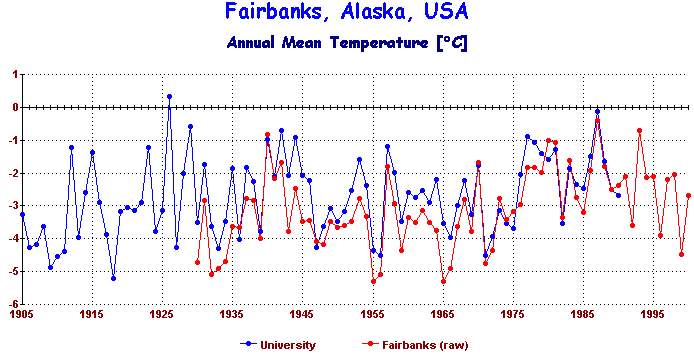
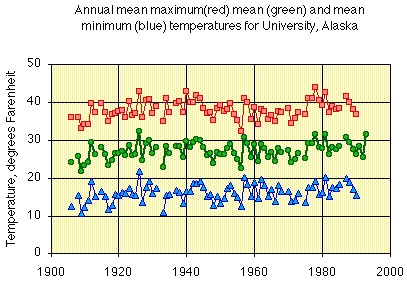
The total record from Nenana suggests either a slight warming during the 20th century (thus melting the ice) or an increase in precipitation (thus breaking the ice dynamically). This may be climatic, driven by temperature or precipitation, and could be caused in part by urban warming of the river in Fairbanks. The authors cite Nenana residents observations that thermal breakups have been more common than dynamic ones in recent years, although they offer no actual data or record to confirm this. At this point the authors' stated aim of demonstrating `climate change' turned an interesting story into a statistical puzzle piece designed to make more of the trend than in fact existed. They sought to compare the ice breakup times and dates with air temperature and precipitation for the region. "We examined the entire record of ice breakup to look for long-term trends in breakup. We compared the ice breakup record from 1949-2000 with available climatic data for Nenana and Fairbanks, Alaska (90 km away)." This was an extraordinary step to take, to use only part of the record for statistical analysis, and to use a cold year (1949) as the start point. In statistics, this is known as `end date distortion', where a long-term trend can be profoundly affected by the choice of start and end dates, particularly where those terminal dates are outside the mean. Significantly, this decision meant that the record early breakup year, 1940, did not affect the analysis. Also significant was their omission of the 2001 breakup date (8th May), from the analysis, even though their paper was not published until late October 2001. This left ample time to include it in such a superficial statistical analysis which could be done on any PC, or even to delay publication of the paper a month or so until the 2001 date was included. They did not state a reason for selecting 1949 as their start point, or for omitting 2001, but it was implied that lack of air temperature data for Nenana itself may have prompted them to do so. However, the Nenana temperature record had large breaks and so the authors mainly relied on data for Fairbanks 56 miles away. Using Fairbanks climatic data leaves no excuses for selecting 1949, as its data for both temperature, precipitation, and snowfall, goes back further than 1917. Fig.3 above shows the effect of this statistical selectivity, the red portion being the period of comparison, which, in the absence of the earlier warm period, produced an upward trend. The failure to include 2001 only magnified that trend. If the whole record is taken, there is a slight trend to climatic warming (urban warming of the river notwithstanding), but much less than would be suggested by using the red portion of the chart. The authors found that Fairbanks had warmed, and that this warmth correlated with the trends in ice breakup dates. But they also pointed out - "Heat-island effects due to urbanization and movement of the weather station may affect the Fairbanks record." For `may' read `do', because the Fairbanks heat island is well documented [4]. Fig.4 shows the temperature record for Fairbanks and the university a few miles away. The university is outside the main urban heat island. Taken together, it is clear that there is an insufficient trend to claim long-term warming. However, if only the post-1949 part of the data is considered, then a warming trend would be evident, due again to `end date distortion', not to any underlying climate change.
Since the Nenana temperature record was too fragmented to mean anything, with a big 15-year gap around 1980, the authors really had no excuse for using 1949 as a start date for determining trends since the Fairbanks and University record above covers the full period of ice breakup data.
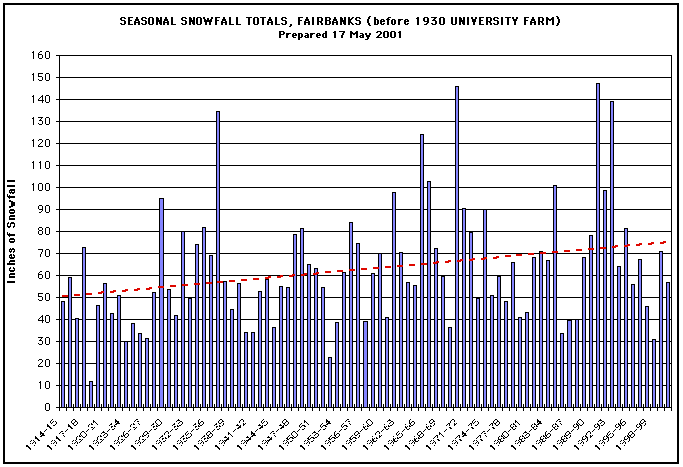
The authors also looked at precipitation and snowfall as a possible cause of the slightly earlier breakup dates in recent decades, stating categorically - "Trends for precipitation and snowfall were non-significant for both cities." Really? That's not how the Alaska Climate Research Center sees it. Here is their plot of snowfall during the 20th century at Fairbanks.
As we can see, there has been a significant increase in total snowfall during the 20th century, the inevitable effect of which would be greater mechanical forces acting upon the river ice from upstream, causing it to break earlier than would be the case with thermal melt alone. But the authors claim - "Although the record does not reveal the mechanisms of breakup, long-time Nenana residents observe that thermal breakups, where the ice under the tripod "rots" away, have been more common than dynamic breakups in recent years." Apart from the fact that it must be difficult to tell from visual observation alone whether river ice ice is being broken up through melt or is breaking up under the strain of mechanical forces from upstream, the authors appear to have been only listening to what they wanted to hear from the residents. They do not even say how many residents they spoke to. It was a most unscientific approach to adopt in what was purportedly a scientific study. The above snowfall data strongly suggests that dynamic breakup was at work, whatever the authors think a few residents might have told them.
Conclusion It is clear from the Nenana Ice Classic data that there has been a slight trend toward earlier breakup dates, but nothing nearly as significant as that claimed by the authors - and hardly justifying a paper about it in a major journal. The authors attribute recent earlier breakups to climatic warming, but it is clear from Alaska Climate Research Center data that there has been little or no warming to speak of over the full period, but that snowfall has increased significantly, contrary to what the authors claim. The authors also make no allowance for the possibility of urban warming of the river itself. Their claims of correlations between river breakup dates and climatic warming are based primarily on selecting only part of the available data, significantly excluding the peak warm year of 1940. They also excluded the data for 2001, a colder than average year, even though there was ample time to include it. Had it been included, it would have made a significant difference to their comparative analysis. But then, they might not have got it published in time for the COP7 climate conference in Marrakech, Morocco, in early November. And it is that political imperative which seems to have underpinned what was really very sloppy science.
References [1] Segarin R., &
Micheli, F., "Climate Change in Non-traditional Data Sets", Science v.294, p.811, [2] `Nenana Ice Classic' - Alaska's Coolest Lottery !',
25 April 2001, [3] Alaska Climate Research Center http://climate.gi.alaska.edu/ [4]
Magee, N., Curtis J., Wendler, G.
"The Urban Heat Island Effect at Fairbanks,
Alaska", Comments Received From "Miceal O'Ronain" <miceal_oronain@hotmail.com>,
28 Oct 2001 From: "George (Jim) Hebbard" <jhebbard@technologist.com>,
28 Oct 2001 I await eagerly their input. From Jerry Brennan <skeptic76@erols.com> 29 Oct 2001 It took me quite a while to realize why, but 1998 was the earliest. Response from John Daly - 29 Oct 2001 Jerry - Point taken. The official Nenana data is based only on calendar dates and times, and this is the basis for Fig.3. However, if an astronomical calendar is used instead, some times/dates would need to be moved slightly. It would not make much difference to the overall pattern of breakup, but as you say, it would make 1998 the record year. 1998 was also the year of the big El Niño (a warming effect) and was in the positive phase of the Pacific Decadal Oscillation (PDO) which has also had a warming effect post-1976. In the last two years, the indications are that the PDO has now moved into its negative phase which would explain the later breakup date in 2001. - John Daly From: Jan Curtis < jcurtis@uwyo.edu > 29 Oct
2001 My limited experience while working at the Alaska Climate Research Center was that snowfall served to insulate
the river ice from the extreme cold, allowing the relatively warmer river to help melt the ice faster from beneath. Light snow cover on the
river could possibly result in delayed breakup. The bottom line is that
river ice dynamics/thermodynamics is very complex and cannot be systematically used as a on/off switch for determining climate change. From: "John S. Baltutis" < baltwo@san.rr.com >, 29 Oct
2001 Sat, 3 Nov 2001 14:14:08 -0000 1/ Thickness of ice. From: Ross McKitrick <rmckitri@uoguelph.ca>
Wed, 07 Nov 2001 16:51 Cheers Ross From: "Dr Wilson Flood" <wilson@flood6.fsnet.co.uk> Wed, 7 Nov 2001
10:18 Response by John Daly - I marked the record from 1949 to 2000 in red because this was the period of time represented by the authors statistical comparisons with Fairbanks and Nenana. It was their selection, not mine. From: Hiram Jacobs <hijacker@MailAndNews.com> Fri, 9 Nov 2001 17:35 With regard to the Nenana Ice Classic study, I noticed that you did not
reference or discuss the study by Magnuson et al. that examined 39 freeze-thaw data records and found trends both for later freeze-up and earlier
spring thaw. Magnuson et al. found that spring thaw was occurring
approximately 10 days earlier over the 150 years encompassed by the records (freeze-up
was occurring about 9 days later). I can't tell from the graph how many days
earlier (from 1940 to present) the Nenana ice break-up is, but the earlier
trend is consistent with Magnuson's data. Some of Magnuson's data is for a |

