![]()
TALKING
TO THE TREES
IN TASMANIA
by
John L. Daly
(copyright 1996, John L. Daly)
![]()
In the politics of greenhouse `science', some scientific papers, fully peer-reviewed, have been published in key scientific journals, the ideological support for the warming scenario being the crucial factor.
In a noted paper, ("Climatic Change in Tasmania Inferred from a 1089-Year Tree-Ring Chronology of Huon Pine", Cook et al. 1991, `Science' v.253, p.1266- 1268), An American tree-ring expert, Ed Cook and his team, presented tree ring data gathered from Huon Pine trees on Mount Read in western Tasmania, and correlated them against historical temperature data for Tasmania. The study received widespread media publicity, as it's conclusions reinforced the greenhouse effect hysteria promoted by some climate modelers. According to Cook et al -
"A
Climatically sensitive huon pine tree-ring chronology from western Tasmania
allows inferences about Austral summer temperature change since A.D. 900.
Since 1965, huon pine growth has been unusually rapid for trees that are
in many cases over 700 years old. This growth increase correlates well
with recent anomalous warming in Tasmania on the basis of instrumental
records and supports claims that a climatic change, perhaps influenced
by greenhouse gases, is in progress".
Fig.1 - `Tasmanian Temperatures' and tree rings according
to Cook et al
As we can see , the recent rapid growth in the old huon pines was attributed entirely to warming. And what a warming! - +1.5 deg. C.! The claimed correlation between this growth and the warming was based on "instrumental records", of which only three were used - Hobart, Launceston, and Low Head Lighthouse. There are, however, numerous long-term measuring sites in Tasmania, many in rural areas, which the Cook team could have used to verify the alleged "recent anomalous warming". There are even measuring sites in western Tasmania closer to the tree site than the three stations chosen, and in the correct climatic zone (see map).
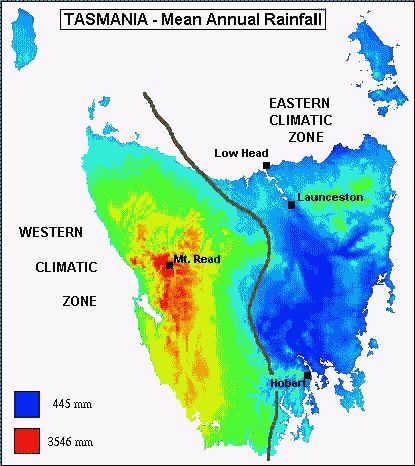
Fig.2 - Map of Tasmania with the key locations
marked.
They went on to claim that this unprecedented post-1965 warming exceeded anything assumed to have occurred in the last 1,089 years, warmer even than the Medieval Warm Epoch of the 11th and 12th centuries (generally thought to have been 1 to 2 degrees celsius warmer, globally, than today). It was a dramatic and ambitious claim, so much so that one would expect the Cook team to produce solid evidence in support. To assess their claims, one first needs to know a few things about Tasmania itself.
Tasmania is a large island of 26,383 square miles (or about the size of Maine), located south of Australia in the `Roaring Forties' of the Southern Ocean. It has a population of 485,000 people, nearly half of whom live in or near only two urban centres of any real size, namely Hobart (pop. 135,000) and Launceston (pop. 75,000). About half of Tasmania is covered in forest (home to the famed Tasmanian Devil), while agriculture is confined mainly to the eastern half of the island, and along the northwestern coast.
Tasmania has two quite distinct climatic zones (see fig.2 map). The western half is mountainous, and directly exposed to moist westerlies from the Southern Ocean, while the eastern half lies in it's rain shadow. Thus, the west is cool and wet, while the east enjoys a drier, more Mediterranean, type of climate. The sharp climatic division between the two halves of the island is easily apparent even to a casual visitor driving across it.
Cook et al made three elementary mistakes in their study.
Firstly, the huon pine trees they chose to examine were located in the western half of Tasmania. However, the temperature records they chose to correlate them with were all located in the eastern half of Tasmania, in a totally different climate zone, at an average distance of 100 miles from the tree site. They might just as well have correlated their tree rings with temperatures in Brisbane or London.
Secondly, having taken their records from the wrong half of the island, Cook et al selectively chose only three weather stations to represent the whole of Tasmania, and all three are affected by significant urban heat islands (ie. localised heat from urban growth distorting historical data). They selected Hobart, Launceston (the two biggest urban centres), and finally Low Head Lighthouse (see map for locations).
Hobart, the largest city on the island, has a documented heat island. An expatriate American, Dr Manuel Nunez of the Dept of Geography at the University of Tasmania, made a detailed spatial study of Hobart temperature patterns in 1979, and found a pronounced heat island of up to +5 deg. C. in some urban locations, mainly at night.
Launceston, the second largest city, sits in a valley surrounded by high ground and hills on all sides, a scaled-down version of the topographical situation in Los Angeles. Like L.A., Launceston experiences inversion layering, with resulting fogs. The heat island there is such that while winter frosts settle frequently on the surrounding countryside, Launceston itself has very few frost days. The Australian Bureau of Meteorology itself acknowledges that the Launceston night temperatures record is flawed for this very reason, giving an artificial warming bias to data (e-mail communication, Neville Nicholls, BMRC, 18-June-1996).
But what of Low Head Lighthouse? Surely
that should be clean?
Perhaps, as long as you don't mind having a big aluminium
smelter, oil-fired power station, heavy
industrial complex, and an urban centre close
by. The lighthouse keeper himself reported that offshore breezes at night
bring air from the industrial complex over his lighthouse, creating in
turn a night-time heat island around the whole district and inducing a
localised warming into Low Head's temperature record.
(In the course of this investigation, an examination of Low Head's data turned up an even bigger surprise. It appears that Low Head had undergone a full +1 deg daytime warming since 1960, not matched anywhere else. Further investigations showed this to be caused by bushes growing near the measuring box, screening it from the prevailing north-westerly winds, turning the site into a daytime sun-trap - thus the illusion of a rise in daytime temperature. See Hot Air At Low Head for details of this other scientific gaffe).
Of all the stations in Tasmania available for temperature analysis, Cook et al chose the three worst stations they could possibly find, all of them guaranteed to show a dummy warming caused by heat islands or other local effects. They could not have made a better choice if they had sought to deliberately show the largest warmings they could possibly find anywhere in Tasmania.
Cook et al could have chosen recording sites closer to the Mount Read tree site where the huon pines were located. There were three such stations - Queenstown, Zeehan, and Strahan, 15 km southwest, 15 km northwest, and 45 km southwest,of Mount Read respectively. Their records are fragmented in time but when merged together, using Queenstown as the base record with uniform corrections of -0.8 deg for Strahan and -0.3 deg for Zeehan (the average difference of these stations to the Queenstown record in the periods of overlap), they do give a more accurate picture of 20th century temperatures in the immediate vicinity of Mount Read.
Even with the merging of the three stations, there are still breaks in data as shown in the graph below. However, the trend is fairly clear - an average temperature of about 13 deg C. early in the century, rising to about 13.5 deg by the latter part of the century - only one third of the temperature rise claimed by Cook et al in their paper (as indicated on their graph). In fact the two graphs are quite different in their temperature trends.
Fig.3
- Composite of western Tasmania temperature based on Queenstown
The third flaw in Cook et al's work is that they made no allowance for the Fertilizer Effect of carbon dioxide (or CO2). Studies in the U.S. and in Tasmania, indicate that many types of vegetation around the world, especially trees, are responding to enriched atmospheric CO2 with stronger recent growth caused by enhanced photosynthesis from enriched CO2 uptake.
This CO2-enhanced growth is quite independent of temperature.
Personal communication with three of the authors, (Trevor Bird, 20-Jan-93, Mike Peterson and Brendan Buckley 24-Jan-93), confirmed that no allowance or correction had been made for CO2 enrichment. Cook et al attributed the recent huon pine growth entirely to greenhouse-induced warming and no part of their paper made any mention of the strong likelihood that the recent growth may have been caused wholly, or even partly, by increased CO2 fertilization from rising atmospheric carbon dioxide.
Furthermore, the trees they selected were at the upper limit of the tree line, where the trees are at the verge of survivability. This makes the trees very responsive to slight environmental changes. Trees and plants in normal environments react positively to CO2 enrichment, all the more reason for trees in marginal environments like the huon pine site, to respond even more vigorously to elevated atmospheric CO2 in recent years.
The Cook et al study was interesting in it's treatments of climates over the last 1,000 or so years, but by pandering to the global warming scare in such an unscientific manner, the rest of their work was largely overshadowed. It is not only the Cook team who lacked scientific rigour in their tree study (insofar as it related to the late 20th century), but part of the blame for such bad science should also attach to the reviewers of the paper and to the editors of `Science' journal itself for accepting such fashionable, but also unsupported, claims so uncritically.
![]()
Back to "Still Waiting For Greenhouse"