The
Missing Sink
by
Dr Vincent Gray
![]()
Greenhouse Bulletin No. 111
January 1998
![]() Only
a proportion of carbon dioxide emissions from combustion of fossil fuels
appears to enter the earth’s atmosphere. The ratio of the annual emissions
to the annual increment in the atmosphere is called the airborne fraction.
Greenhouse Bulletin No 106 gave the latest charts for the annual emissions
of carbon dioxide by fossil fuels and for the concentration of carbon dioxide
in the atmosphere as measured since 1959 at Mauna Loa, Hawaii, and pointed
out that for the 25 years from 1971 to 1996 a 54% increase in fossil fuel
emissions had had no apparent influence on the approximately constant annual
carbon dioxide increment in the atmosphere. The airborne fraction has declined.
Only
a proportion of carbon dioxide emissions from combustion of fossil fuels
appears to enter the earth’s atmosphere. The ratio of the annual emissions
to the annual increment in the atmosphere is called the airborne fraction.
Greenhouse Bulletin No 106 gave the latest charts for the annual emissions
of carbon dioxide by fossil fuels and for the concentration of carbon dioxide
in the atmosphere as measured since 1959 at Mauna Loa, Hawaii, and pointed
out that for the 25 years from 1971 to 1996 a 54% increase in fossil fuel
emissions had had no apparent influence on the approximately constant annual
carbon dioxide increment in the atmosphere. The airborne fraction has declined.
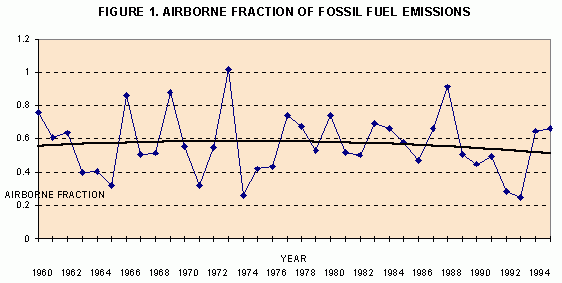
![]() Figure
1 shows this point in greater detail. It is a plot of the airborne fraction
for each year between 1960 and 1995. The trend line is a second order polynomial,
which shows a decline in the airborne fraction from 1971 to 1995 from 0.58
to 0.50, a reduction of 13%.
Figure
1 shows this point in greater detail. It is a plot of the airborne fraction
for each year between 1960 and 1995. The trend line is a second order polynomial,
which shows a decline in the airborne fraction from 1971 to 1995 from 0.58
to 0.50, a reduction of 13%.
![]() Figure
2 shows the annual amount of carbon entering the atmosphere, calculated
from the Mauna Loa figures
Figure
2 shows the annual amount of carbon entering the atmosphere, calculated
from the Mauna Loa figures
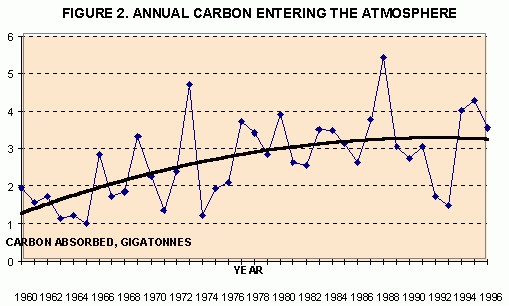
![]() Again,
a second order polynomial trend line has been drawn through the points.
It shows that the average annual increment of carbon in the atmosphere
has now reached an approximately constant value of 3.2 Gigatonnes of carbon
per year.
Again,
a second order polynomial trend line has been drawn through the points.
It shows that the average annual increment of carbon in the atmosphere
has now reached an approximately constant value of 3.2 Gigatonnes of carbon
per year.
![]() If
it is assumed that the carbon entering the atmosphere comes entirely from
fossil fuel emissions, then the remainder of the fossil fuel emissions
must be absorbed by the earth. Figure 3 shows the results of making this
assumption.
If
it is assumed that the carbon entering the atmosphere comes entirely from
fossil fuel emissions, then the remainder of the fossil fuel emissions
must be absorbed by the earth. Figure 3 shows the results of making this
assumption.
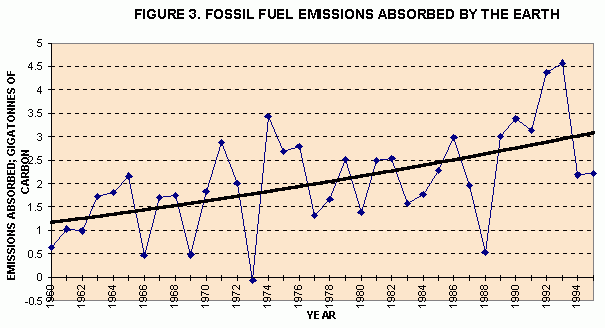
![]() Again,
a second order polynomial trend line has been drawn. It shows that the
emissions absorbed by the earth have increased from 1.2GtCarbon in 1960
to 3.1GtC in 1995. The rate is accelerating. Where is the carbon dioxide
going? Part must be absorbed by the ocean and part by the "terrestrial
biosphere".
Again,
a second order polynomial trend line has been drawn. It shows that the
emissions absorbed by the earth have increased from 1.2GtCarbon in 1960
to 3.1GtC in 1995. The rate is accelerating. Where is the carbon dioxide
going? Part must be absorbed by the ocean and part by the "terrestrial
biosphere".
![]() There
is considerable disagreement amongst carbon cycle modellers on the amount
of carbon annually absorbed by the oceans. The Intergovernmental Panel
on Climate Change (IPCC) (Houghton et al. 1996)
has consistently, in all its reports, summarised these disagreements by
quoting the average annual ocean absorption over the period 1980-1989 as
2.0±0.8 GtC/yr. If the mean value, 2.0GtC/yr, is taken, then, from
Figure 3, an average of 0.3GtC/yr would be absorbed by the "terrestrial
biosphere" over 1980-1989. If a higher figure is taken, then there
is little or no absorption by plants. If the lower figures are chosen,
then plant uptake may have been as high as 1.0GtC/yr. It might also be
noted that the confidence limits to the figure 2.0 are only ±90%.
There is a 10% chance that the highest or lowest figures might be right.
There
is considerable disagreement amongst carbon cycle modellers on the amount
of carbon annually absorbed by the oceans. The Intergovernmental Panel
on Climate Change (IPCC) (Houghton et al. 1996)
has consistently, in all its reports, summarised these disagreements by
quoting the average annual ocean absorption over the period 1980-1989 as
2.0±0.8 GtC/yr. If the mean value, 2.0GtC/yr, is taken, then, from
Figure 3, an average of 0.3GtC/yr would be absorbed by the "terrestrial
biosphere" over 1980-1989. If a higher figure is taken, then there
is little or no absorption by plants. If the lower figures are chosen,
then plant uptake may have been as high as 1.0GtC/yr. It might also be
noted that the confidence limits to the figure 2.0 are only ±90%.
There is a 10% chance that the highest or lowest figures might be right.
![]() Trends
in ocean uptake depend on the particular model. The IPCC (Houghton
et. al. 1995, Figure 1.7. page 47) selected the GFDL (Geophysics
Fluid Dynamics Laboratory, Princeton) model as an illustration.
It shows an ocean uptake of 0.92GtC in 1960, 1.41GtC in 1970, 1.81GtC in
1980, 2.29GtC in 1990 and (extrapolating), 2.78GtC in 1995. This would
mean that the "terrestrial biosphere" absorbed zero carbon in
1960, 0.31Gt in 1970, 0.35GtC in 1980, 0.41GtC in 1990 and 0.52GtC in 1995.
Trends
in ocean uptake depend on the particular model. The IPCC (Houghton
et. al. 1995, Figure 1.7. page 47) selected the GFDL (Geophysics
Fluid Dynamics Laboratory, Princeton) model as an illustration.
It shows an ocean uptake of 0.92GtC in 1960, 1.41GtC in 1970, 1.81GtC in
1980, 2.29GtC in 1990 and (extrapolating), 2.78GtC in 1995. This would
mean that the "terrestrial biosphere" absorbed zero carbon in
1960, 0.31Gt in 1970, 0.35GtC in 1980, 0.41GtC in 1990 and 0.52GtC in 1995.
![]() The
evidence is, then, that there may be a substantial global net absorption
of the fossil fuel emissions of carbon dioxide by plants, and that this
absorption is increasing each year, as the absorption by the atmosphere
remains constant and the fossil fuel emissions increase.
The
evidence is, then, that there may be a substantial global net absorption
of the fossil fuel emissions of carbon dioxide by plants, and that this
absorption is increasing each year, as the absorption by the atmosphere
remains constant and the fossil fuel emissions increase.
![]() Yet
the impression given by the IPCC, and by the carbon cycle modellists, is
that the land surface of the earth emits carbon dioxide. An emphasis has
been placed on "land-use changes" and "deforestation",
both of which are considered to give a net emission of carbon dioxide.
Thus in the 1960 IPCC report a figure of 1.6±1.0GtC/yr was given
as emissions from "deforestation and land use". These figures
resulted from trends in forest inventories compiled by R.A. Houghton and
associates at Woods Hole, Mass which go back to 1840.
Yet
the impression given by the IPCC, and by the carbon cycle modellists, is
that the land surface of the earth emits carbon dioxide. An emphasis has
been placed on "land-use changes" and "deforestation",
both of which are considered to give a net emission of carbon dioxide.
Thus in the 1960 IPCC report a figure of 1.6±1.0GtC/yr was given
as emissions from "deforestation and land use". These figures
resulted from trends in forest inventories compiled by R.A. Houghton and
associates at Woods Hole, Mass which go back to 1840.
![]() One
set of these estimates was used as an input to the IPCC carbon cycle model
exercise (Enting et al. 1994). They assumed
that there was a steady increase in net emissions from land use changes
since 1850. The net emission figure for 1990 was 1.71GtC.
One
set of these estimates was used as an input to the IPCC carbon cycle model
exercise (Enting et al. 1994). They assumed
that there was a steady increase in net emissions from land use changes
since 1850. The net emission figure for 1990 was 1.71GtC.
![]() Although
these figures were supposed to apply globally, the IPCC chose to restrict
the figures for their future emissions scenarios (Pepper
et al.; J.Houghton et al. 1992) to net tropical deforestation. The
figure of 1.6±1.0GtC/yr) appears as "emissions from deforestation
and land use" in the 1990 report (Houghton et
al. 1990) but became "net emissions from changes in tropical
land-use" in Climate Change 1994 (Houghton et
al. 1995) and Climate Change 1995 (Houghton
et al 1996).
Although
these figures were supposed to apply globally, the IPCC chose to restrict
the figures for their future emissions scenarios (Pepper
et al.; J.Houghton et al. 1992) to net tropical deforestation. The
figure of 1.6±1.0GtC/yr) appears as "emissions from deforestation
and land use" in the 1990 report (Houghton et
al. 1990) but became "net emissions from changes in tropical
land-use" in Climate Change 1994 (Houghton et
al. 1995) and Climate Change 1995 (Houghton
et al 1996).
![]() Of
course, this caused an imbalance in the carbon budget, which was originally
attributed to a mysterious "missing sink". As the imbalance must
be met by plant growth somewhere the IPCC has now accepted this obvious
fact, but cannot let go of the concept of "emissions" from land
use changes. They therefore (Houghton et al 1996)
subdivide the terrestrial component of the carbon budget into "net
emissions from changes in tropical land-use; +1.6±1.0GtC/yr, "Uptake
by Northern Hemisphere forest regrowth, -0.5±0.5GtC/yr, "CO2
and N2 fertilisation",-1.3±1.5GtC/yr
Of
course, this caused an imbalance in the carbon budget, which was originally
attributed to a mysterious "missing sink". As the imbalance must
be met by plant growth somewhere the IPCC has now accepted this obvious
fact, but cannot let go of the concept of "emissions" from land
use changes. They therefore (Houghton et al 1996)
subdivide the terrestrial component of the carbon budget into "net
emissions from changes in tropical land-use; +1.6±1.0GtC/yr, "Uptake
by Northern Hemisphere forest regrowth, -0.5±0.5GtC/yr, "CO2
and N2 fertilisation",-1.3±1.5GtC/yr
![]() This
gives a net absorption by the terrestrial biosphere of 0.2 ± 1.9GtC/yr,
close to the 0.3GtC/yr figure for the 1980s from Figure 3, and it is increasing.
Again, note that the confidence limits are ±90%. There is a 10%
chance that there is a net absorption of carbon dioxide by plants of 2.1GtC/yr
or a net emission of 1.7GtC/yr.
This
gives a net absorption by the terrestrial biosphere of 0.2 ± 1.9GtC/yr,
close to the 0.3GtC/yr figure for the 1980s from Figure 3, and it is increasing.
Again, note that the confidence limits are ±90%. There is a 10%
chance that there is a net absorption of carbon dioxide by plants of 2.1GtC/yr
or a net emission of 1.7GtC/yr.
![]() This
admission by the IPCC that some carbon dioxide emitted by combustion of
fossil fuels is, on average being absorbed by plants, is thus leading to
an overall increase in the net productivity of agriculture and forestry,
and is therefore beneficial, has been ignored by the media, and has been
unnoticed by the general public.
This
admission by the IPCC that some carbon dioxide emitted by combustion of
fossil fuels is, on average being absorbed by plants, is thus leading to
an overall increase in the net productivity of agriculture and forestry,
and is therefore beneficial, has been ignored by the media, and has been
unnoticed by the general public.
![]() The
Woods Hole researchers are unrepentant. Dixon et al. (1994)
recalculated their estimates of changes in carbon fluxes by the world’s
forests and now produce a figure of -0.9±0.4GtC/yr over recent years;
a reduction on their previous estimates. However, they insist "if
the missing C was to be accumulating in these Northern forests, the observed
rate of growth must have been an underestimate of the actual rates by a
factor of up to 4, which is unlikely". They have produced a model
(Melillo et al. 1993) which admits the possibility
that the terrestrial biosphere might become a net absorber of carbon.
The
Woods Hole researchers are unrepentant. Dixon et al. (1994)
recalculated their estimates of changes in carbon fluxes by the world’s
forests and now produce a figure of -0.9±0.4GtC/yr over recent years;
a reduction on their previous estimates. However, they insist "if
the missing C was to be accumulating in these Northern forests, the observed
rate of growth must have been an underestimate of the actual rates by a
factor of up to 4, which is unlikely". They have produced a model
(Melillo et al. 1993) which admits the possibility
that the terrestrial biosphere might become a net absorber of carbon.
![]() Meanwhile
the evidence mounts up that the plants are absorbing some of the extra
carbon dioxide. The missing sink has been found.
Meanwhile
the evidence mounts up that the plants are absorbing some of the extra
carbon dioxide. The missing sink has been found.
![]() Charles
Keeling of the Scripps Institute, La Jolla, CA, whose carbon dioxide measurements
at Mauna Loa, Hawaii are the first accurate ones, was one of the first
to indicate, from a detailed model, from studies of the 13C/12C isotope
ratio, and from the changes in seasonal amplitude of carbon dioxide, that
there had to be a significant absorption by plants, particularly in the
Northern Hemisphere (Keeling et al., 1989).
He has followed this up by subsequent supporting evidence (Keeling
et al 1995). Pieter Tans, and the NOAA team at Boulder, Colorado
calculated a lower ocean uptake from measurements and postulated a significant
carbon uptake by Northern Hemisphere forests (Tans
et al. 1990). They have provided further supporting evidence (Francey
et. al. 1995). The rejection of this evidence by the Woods Hole
team led to the comment by Taylor (1993) "Until we can do such an
analysis, predictions of future CO2 concentrations and the efficiency of
policies directed at stabilising atmospheric CO2 must remain questionable".
Charles
Keeling of the Scripps Institute, La Jolla, CA, whose carbon dioxide measurements
at Mauna Loa, Hawaii are the first accurate ones, was one of the first
to indicate, from a detailed model, from studies of the 13C/12C isotope
ratio, and from the changes in seasonal amplitude of carbon dioxide, that
there had to be a significant absorption by plants, particularly in the
Northern Hemisphere (Keeling et al., 1989).
He has followed this up by subsequent supporting evidence (Keeling
et al 1995). Pieter Tans, and the NOAA team at Boulder, Colorado
calculated a lower ocean uptake from measurements and postulated a significant
carbon uptake by Northern Hemisphere forests (Tans
et al. 1990). They have provided further supporting evidence (Francey
et. al. 1995). The rejection of this evidence by the Woods Hole
team led to the comment by Taylor (1993) "Until we can do such an
analysis, predictions of future CO2 concentrations and the efficiency of
policies directed at stabilising atmospheric CO2 must remain questionable".
![]() Ralph
Keeling , Charles’ son (1996), has calculated,
by measuring global and hemispheric oxygen concentrations, that for the
1991-1994 period the global oceans and the northern land biota each removed
the equivalent of approximately 30% of fossil fuel CO2 emissions, while
the tropical land biota were neither a strong source or sink. If this is
confirmed by future measurements, it should settle the matter.
Ralph
Keeling , Charles’ son (1996), has calculated,
by measuring global and hemispheric oxygen concentrations, that for the
1991-1994 period the global oceans and the northern land biota each removed
the equivalent of approximately 30% of fossil fuel CO2 emissions, while
the tropical land biota were neither a strong source or sink. If this is
confirmed by future measurements, it should settle the matter.
![]() Myneni
et al (1997). (which included Charles Keeling)
added further weight to these conclusions by detecting the existence of
increased plant growth in the northern high latitudes from 1981 to 1991
by satellite observations.
Myneni
et al (1997). (which included Charles Keeling)
added further weight to these conclusions by detecting the existence of
increased plant growth in the northern high latitudes from 1981 to 1991
by satellite observations.
![]() To
summarise. It is increasingly evident that a substantial proportion (maybe
30%) of fossil fuel emissions are absorbed, mainly in the Northern Hemisphere,
as additional crops and forest growth, and that the "net emissions
from land use changes" and the "missing sink" have to be
abandoned. It even seems possible, then, that on balance, the increase
of carbon dioxide in the atmosphere provides more benefits than misfortunes
To
summarise. It is increasingly evident that a substantial proportion (maybe
30%) of fossil fuel emissions are absorbed, mainly in the Northern Hemisphere,
as additional crops and forest growth, and that the "net emissions
from land use changes" and the "missing sink" have to be
abandoned. It even seems possible, then, that on balance, the increase
of carbon dioxide in the atmosphere provides more benefits than misfortunes
REFERENCES
Dixon, R.K., S. Brown, R.A. Houghton, A.M. Solomon, M.C. Trexler, J. Wisniewski. 1994. Carbon Pools and Flux of Global Forest Ecosystems. Science 263 185-190
Enting, I.G., T.M.L. Wigley, and M. Heimann, 1994, Future Emissions and Concentrations of Carbon Dioxide: Key Ocean/Atmosphere/Land Analyses. CSIRO Division of Atmospheric Research Technical Paper No 31. CSIRO Melbourne, Australia
Francey, R.J., P.P. Tans, C.E. Allison, I.G. Enting, J.W.C. White & M. Troller. 1995. Changes in oceanic and terrestrial carbon uptake since 1982. Nature 373, 326-330
Houghton, J.T, G.J Jenkins,., and J.J Ephraums,. (Eds.) 1990 Climate Change: The IPCC Scientific Assessment, Cambridge University Press. (IPCC90)
Houghton, J.T., B. A. Callander and S.K. Varney, (Eds.) 1992. Climate Change 1992.The Supplement to the IPCC Scientific Assessment. Cambridge University Press
Houghton, J.T., L.G. Meira Filho, J. Bruce, Hoesung Lewe, B.A. Callander, E. Haites, N. Harris, K. Maskell, (Eds), 1995, Climate Change 1994: Radiative Forcing of Climate Change and An Evaluation of the IPCC IS92 Emission Scenarios. Cambridge University Press.
Houghton, J.T., L.G. Meira Filho, B.A. Callander, N. Harris, A Kattenberg and K. Maskell, (Eds)., 1996. Climate Change 1995: The Science of Climate Change, Cambridge University Press.
Melillo, J.M., A.D. McGuire, D.W. Kicklighter, B. Moore, C.J. Vorosmarty & A.L Schloss. 1993. Global Climate Change and terrestrial net primary production. Nature, 363 234-239
Myneni, R.B., C,D, Keeling, C.J. Tucker, G. Asrar, & R.R. Nemani , 1997. Increased plant growth in the northern high latitudes from 1981 to 1991. Nature 386 698-702
Pepper, W., J. Leggett, R. Swart, J. Wasson. J. Edmonds, I. Mintzer 1992 Emission Scenarios for the IPCC: an Update. Supplementary Report to Climate Change 1992.
Keeling, R.F., Piper, S.C., & Heimann, M., 1996 Global and hemispheric CO2 sinks deduced from changes in atmospheric O2 concentration. Nature 381, 218-221.
Keeling, C.D., R.B. Bacastow, A.F. Carter, S.C. Piper, T.P. Whorf, M. Heimann, W.G. Mook and H. Roeleffzen. 1989. A Three dimensional model of Atmospheric CO2 transport based on observed winds, 1. Analysis of Observational Data, 2 (Heimann & Keeling) Model Description and Simulated Tracer experiments. in Aspects of Climate Variability in the Pacific and the Western Americas, D.H. Peterson, Eds, Geophysical Monograph 55, American Geophysical Union, Washington, D.C . Pp 165-363.
Keeling, C.D., T.P. Whorf, M. Wahlen & J. van der Plicht 1995, Interannual extremes in the rate of rise of atmospheric carbon dioxide since 1980. Nature 375 666-670.
Tans, P., I.Y. Fung, T. Takahashi, 1990. Observational Constraints on the Global Atmospheric CO2 budget. Science 247, 1431-1438 Taylor, J. 1993 The mutable carbon sink. Nature, 366 515-516.
Vincent R. Gray
, M.A.,Ph.D., F.N.Z.I.C. 29.1.98
Climate Consultant
75 Silverstream Road
Crofton Downs
Wellington 6004,
New Zealand
Phone (FAX) (064) (04)
4795939
Email VINCEGRAY@xtra.co.nz
![]()
Return to "Still Waiting For Greenhouse"